
Fig. 4
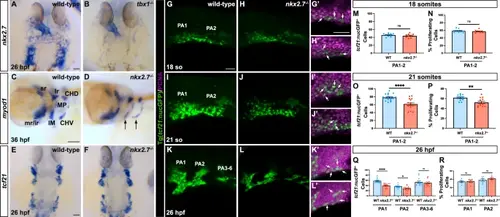
Branchiomeric muscle progenitor proliferation is disrupted in the absence of Nkx2.7. ISH for nkx2.7 in wild-type (n = 4) (A) and tbx1−/− (n = 4) (B) embryos illuminates significant loss of nkx2.7 expression in the PAs at 26 hpf. Scale bar, 50 μm. myod1 transcripts in wild-type (n = 20) (C) and nkx2.7−/− (n = 10) (D) embryos are downregulated in the Intermandibularis (IM) and the Constrictor Hyoideus Ventralis (CHV) precursors at 36 hpf. Expression of myod1 is also detected in the superior rectus (sr), lateral rectus (lr), medical rectus (mr), inferior rectus (ir), Constrictor Hyoideus Dorsalis (CHD), and the Masticatory Plate (MP). Lateral views, anterior to the left. Scale bar, 50 μm. E, F tcf21 ISH shows no overt discrepancy in pharyngeal arch expression between wild-type (n = 8) and nkx2.7−/− (n = 9) embryos. Dorsal views, anterior to the top. Scale, 50 μm. G–L Maximum projection images of confocal z-stacks of wild-type and nkx2.7−/− embryos carrying Tg(tcf21:nucGFP) demarcate the BM progenitors in the PA1, PA2, and PA3-6 (posterior arches) at 18 so (wild-type, n = 10; nkx2.7−/−, n = 9) (G,H), at 21 so (wild-type, n = 19; nkx2.7−/−, n = 17) (I, J), at 26 hpf (wild-type, n = 15; nkx2.7−/−, n = 15) (K, L). Insets show higher magnification images of PAs with PCNA immunostaining in both wild-type and nkx2.7−/− embryos, respectively, at 18 so (G’,H’), 21 so (I’,J’), and 26 hpf (K’,L’). White arrows highlight PCNA+tcf21:nucGFP+ cells. Lateral view, anterior to the left. Scale, 100 μm (G–L) and scale, 50 μm (G’-L’). M–R Quantification of BM progenitors and percentage of PCNA+ cells in specific PAs reveal no statistically significant differences in specification or proliferation in the absence of nkx2.7 at 18 so (M, N). However, a statistically significant decrement in BM progenitors is evident at 21 so, with an associated proliferative defect (p < 0.0001 for O and p = 0.0037 for P) (O, P). While the statistically significant decrease in PA1 and PA2 BM progenitors persists at 26 hpf, there is no evidence of abnormal proliferation at this timepoint (PA1, p < 0.0001; PA2, p = 0.0102) (Q, R). The number of samples for each genotype and timepoint are noted above. Mean and standard error of each data set are shown. Unpaired, two-tailed Student’s t-test is used to demonstrate statistically significance. |