
- Title
-
Mechanism of etoposide resistance in small cell lung cancer and the potential therapeutic options
- Authors
- Fan, Y.W., Liu, M.H., Xu, T.J., Fan, R.Y., Xiang, J., Wu, J.Q., He, M.F.
- Source
- Full text @ Med Oncol

Characteristics of H1048-ER cells in vitro. A Morphological differences between the parent cell line (H1048) and etoposide-resistant strain (H1048-ER) under an inverted microscope. B Viability of H1048 cells and H1048-ER cells treated by etoposide (0.008, 0.04, 0.2, 1, 5, 25, 125, and 625 µM) for 24 h. C Proliferation curves of H1048 cells (black line) and etoposide-resistant H1048-ER cells (red line). D Imaging and quantification of H1048 cells and H1048-ER cells in the migration experiment. E Imaging and quantification of H1048 cells and H1048-ER cells in the invasion experiment. ns no significance, and ***P < 0.001 |
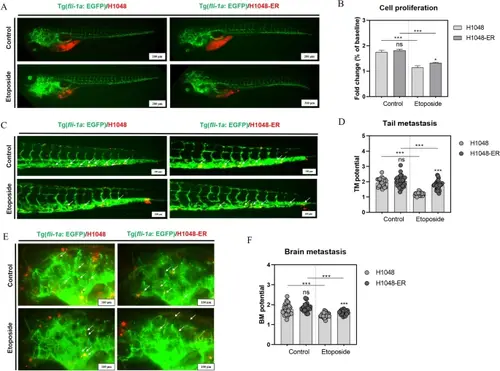
Inhibitory effects of etoposide upon proliferation, and tail and brain metastasis of H1048 cells and H1048-ER cells in a zebrafish xenograft model. A Imaging and B quantification of the proliferation of H1048 cells and H1048-ER cells in zebrafish at 3 days post-treatment (dpt, by soaking of etoposide at 300 μM). C Imaging and D quantification of tail metastasis of H1048 cells and H1048-ER cells in zebrafish at 3 dpt (by intracardiac injection of etoposide at 5.88 ng/embryo). E Imaging and F quantification of brain metastasis of H1048 cells and H1048-ER cells in zebrafish at 3 dpt (by intracardiac injection of etoposide at 5.88 ng/embryo). White arrows denote cells in tail and brain metastasis. ns no significance. ***P < 0.001 |

Differentially expressed genes (DEGs) in H1048-ER cells and H1048 cells. A Volcano map of DEGs. Red, gray, and blue dots represent DEGs with upregulated, unchanged, and downregulated expression, respectively. B Clustering heatmap of DEGs. C Bubble map after enrichment analysis using the GO database. The larger the circle, the greater the number of DEGs enriched to that term. The closer the circle is to the top of the image, the greater the significance of the term. D Bubble map after enrichment analysis using the KEGG database. The larger the circle, the greater the number of DEGs enriched to that term. The closer the circle is to the top of the image, the greater the significance of the term. E Bubble map after enrichment analysis using the Reactome database. The larger the circle, the greater the number of DEGs enriched in this pathway. The closer the circle is to the top of the image, the more significant the pathway becomes. F Venn diagram of enrichment using GO, KEGG, and Reactome database |
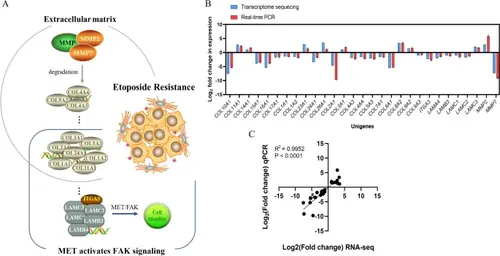
Analyses of selected deferentially expressed genes (DEGs). A DEGs involved in biological processes and signaling pathways (schematic). B Comparison of RNA-seq results and qPCR results. C Correlation analysis between RNA-seq results and qPCR results |
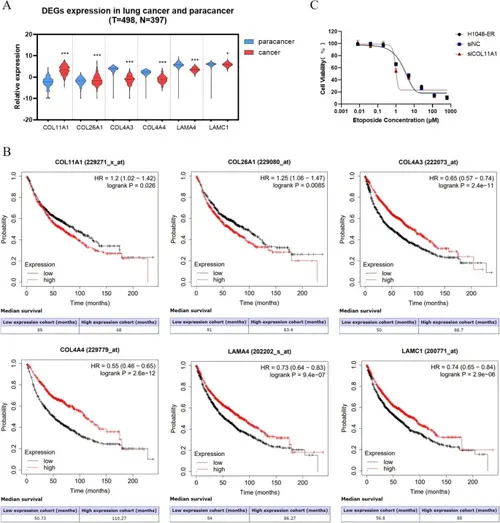
Clinical correlation analyses of key differential expressed genes (DEGs) through TCGA and Kaplan–Meier Plotter database. A Relative expression of genes in tumor tissues (red) and adjacent tissues (blue) of lung cancer. B Influence of gene expression on the survival of patients with lung cancer. C Viability of H1048-ER, siNC-H1048-ER, and siCOL11A1-H1048-ER cells treated etoposide (0.008, 0.04, 0.2, 1, 5, 25, 125, or 625 µM) for 48 h |

Anti-proliferation and anti-metastasis effects of cisplatin, doxorubicin, and temozolomide on H1048 cells and H1048-ER cells in vitro and in vivo. A Growth curves of the parent cell line (H1048) and drug-resistant cell line (H1048-ER) under treatment with cisplatin (0.0096, 0.048, 0.24, 1.2, 6, 30, 150, and 300 μM), doxorubicin (0.0096, 0.048, 0.24, 1.2, 6, 30, 150, and 300 μM), or temozolomide (0.008, 0.04, 0.2, 1, 5, 25, 125, and 625 μM) for 24 h. Evaluation of B anti-proliferation, C anti-tail and D anti-brain metastasis activity of cisplatin (30 μM for proliferation assay, 0.6 pg/embryo for metastasis assay), doxorubicin (5 μM for proliferation assay, 1.09 pg/embryo for metastasis assay), and temozolomide (120 μM for proliferation assay, 3.88 pg/embryo for metastasis assay) against H1048 cells and H1048-ER cells in a zebrafish xenograft model at 3 dpt. ns no significance, *P < 0.033, **P < 0.002, and ***P < 0.001 |