
FIGURE
Fig. 5
- ID
- ZDB-FIG-250513-48
- Publication
- Fan et al., 2025 - Mechanism of etoposide resistance in small cell lung cancer and the potential therapeutic options
- Other Figures
- All Figure Page
- Back to All Figure Page
Fig. 5
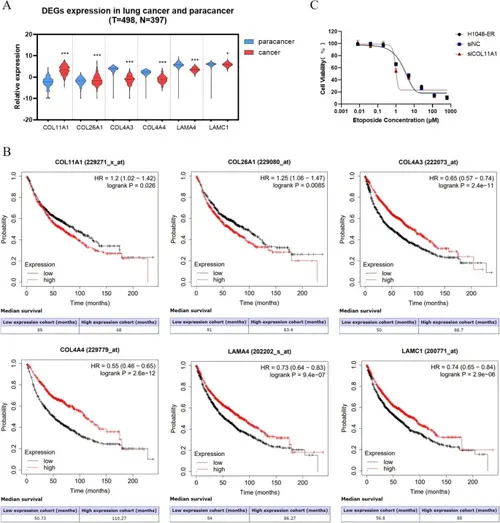
Clinical correlation analyses of key differential expressed genes (DEGs) through TCGA and Kaplan–Meier Plotter database. A Relative expression of genes in tumor tissues (red) and adjacent tissues (blue) of lung cancer. B Influence of gene expression on the survival of patients with lung cancer. C Viability of H1048-ER, siNC-H1048-ER, and siCOL11A1-H1048-ER cells treated etoposide (0.008, 0.04, 0.2, 1, 5, 25, 125, or 625 µM) for 48 h |
Expression Data
Expression Detail
Antibody Labeling
Phenotype Data
Phenotype Detail
Acknowledgments
This image is the copyrighted work of the attributed author or publisher, and
ZFIN has permission only to display this image to its users.
Additional permissions should be obtained from the applicable author or publisher of the image.
Full text @ Med Oncol