
|
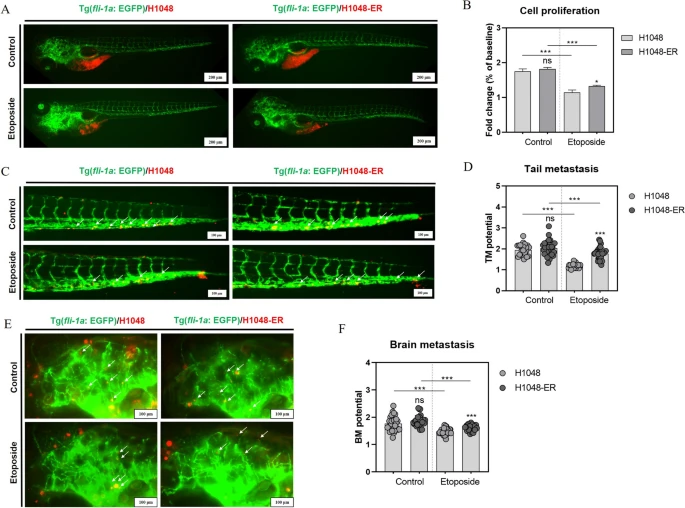
Fig. 2 Inhibitory effects of etoposide upon proliferation, and tail and brain metastasis of H1048 cells and H1048-ER cells in a zebrafish xenograft model. A Imaging and B quantification of the proliferation of H1048 cells and H1048-ER cells in zebrafish at 3 days post-treatment (dpt, by soaking of etoposide at 300 μM). C Imaging and D quantification of tail metastasis of H1048 cells and H1048-ER cells in zebrafish at 3 dpt (by intracardiac injection of etoposide at 5.88 ng/embryo). E Imaging and F quantification of brain metastasis of H1048 cells and H1048-ER cells in zebrafish at 3 dpt (by intracardiac injection of etoposide at 5.88 ng/embryo). White arrows denote cells in tail and brain metastasis. ns no significance. ***P < 0.001