
Image
|
Figure Caption
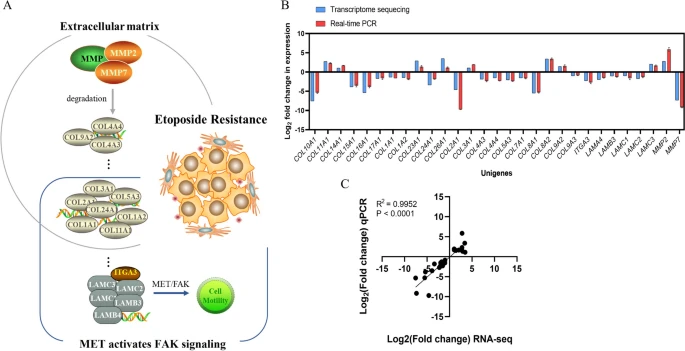
Fig. 4 Analyses of selected deferentially expressed genes (DEGs). A DEGs involved in biological processes and signaling pathways (schematic). B Comparison of RNA-seq results and qPCR results. C Correlation analysis between RNA-seq results and qPCR results
Acknowledgments
This image is the copyrighted work of the attributed author or publisher, and
ZFIN has permission only to display this image to its users.
Additional permissions should be obtained from the applicable author or publisher of the image.
Full text @ Med Oncol