FIGURE SUMMARY
Title

The Role of tRNA Fragments on Neurogenesis Alteration by H₂O₂-induced Oxidative Stress

Authors
Karacicek, B., Katkat, E., Binokay, L., Ozhan, G., Karakülah, G., Genc, S.
Source
Full text @ J. Mol. Neurosci.

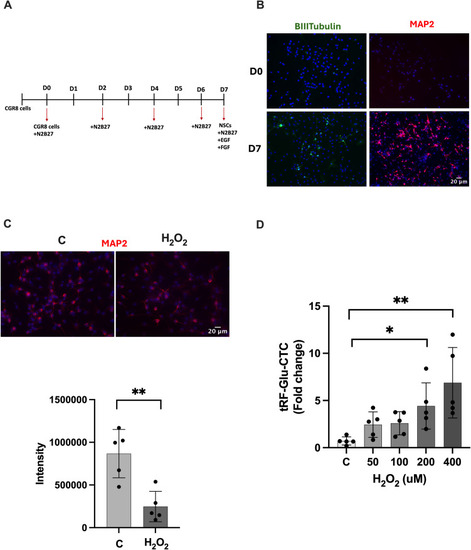
CGR8 neural differention to NSC and the changes of tRF-Glu-CTC level under different H2O2 concentrations. A Differentiation scheme of CGR8 into NSCs. B Immunofluorescence staining of neuronal markers(ßIII-tubulin and MAP2) at 7th day, images were taken 20 × magnification, Olympus IX61 fluorescent microscope). C Immunofluorescence staining of NSCs for neuronal marker (MAP2) after H2O2 exposure (images were taken 40 × magnification, Olympus IX61 fluorescent microscope) and intensity analysis (data are presented as mean ± SD, n = 5, Shapiro–Wilk test, **p < 0.01). D Changes in the levels of tRF-Glu-CTC in NSCs at different H2O2 concentrations (data are presented as mean ± SD, n = 5, one-way ANOVA Dunnett test, *p < 0.05, **p < 0.01)

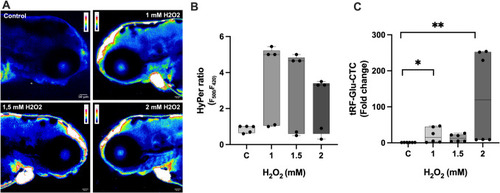
Effect of in vivo HyPer zebrafish H2O2 exposure on tRF-Glu-CTC levels. A H2O2 levels in 72 hpf HyPer zebrafish embryos for 24 h. HyPer imaging for different concentrations of H2O2. The H2O2 levels are inferred from the F500/F420 excitation ratio of HyPer. Respectively, control, 1 mM, 1.5 mM, and 2 mM H2O2. B Quantification of the H2O2 levels in the control and H2O2 concentrations in 72 hpf HyPer zebrafish embryos; images were taken 20 × magnification, Zeiss LSM 880 confocal microscopy (data are presented as boxplot, n = 5, ns, Kruskal–Wallis test, p = 0.168). C Changes in levels of tRF-Glu-CTC fragment in HyPer 72 hpf embryos after 24 h H2O2 exposure (data are presented as boxplot, n = 6, Kruskal–Wallis test, *p < 0.05, **p < 0.01)

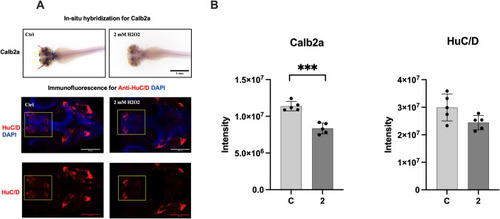
Effect of in vivo AB wild-type zebrafish H2O2 exposure on tRF-Glu-CTC neurogenesis. Role of H2O2 on neurogenesis. A In situ hybridization (Calb2a) and immunofluorescence (HuC/D) images of in wild-type AB zebrafish 72 hpf embryos after 24 h H2O2 exposure. Calb2a expression decreases in various cranial structures, including the olfactory bulb (yellow arrows), retina (red arrows), cerebellum (green arrows), and hindbrain (blue arrows). Anti-HuC/D (red) staining of the heads of zebrafish larvae obtained from confocal microscopy. Yellow labels indicate telencephalon and habenula, respectively. B Intensity analysis of Calb2a and HuC/D (Data are presented as mean ± SD, n = 5, t-test, for Calb2a ***p < 0.001 and HuC/D p = 0.057). C, control; 2, 2 mM H2O2

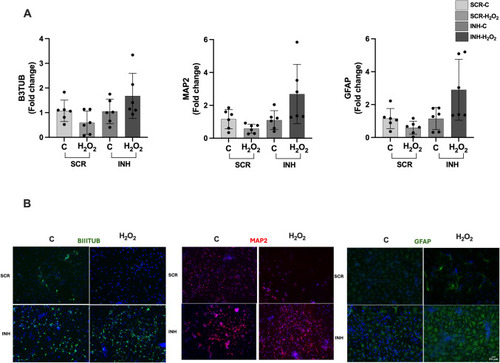
Role of tRF-Glu-CTC inhibition on neurogenesis of NSCs. A Expression levels of neurogenesis markers (ßIII-tubulin, MAP2, and GFAP) after transfection of SCR and tRF-Glu-CTC antisense 2′-OMe-RNA (inhibitor) in 50 μM H2O2 for 6 h for neurogenesis markers (data are presented as mean ± SD, n = 6, t-test, BIIITUB t-test, C-SCR vs. H2O2-SCR p = 0.097 and C-INH vs. H2O2-INH p = 0.171, MAP2 t-test, C-SCR vs. H2O2-SCR p = 0.067 and C-INH vs. H2O2-INH p = 0.054, GFAP t-test, C-SCR vs. H2O2-SCR p = 0.090, C-INH vs. H2O2-INH, Mann–Whitney test p = 0.180). B Immunofluorescence images of neurogenesis markers (ßIII-tubulin, MAP2, and GFAP) after transfection (images were taken 20 × magnification, Olympus IX61 fluorescent microscope). INH, inhibitor; SCR, scramble

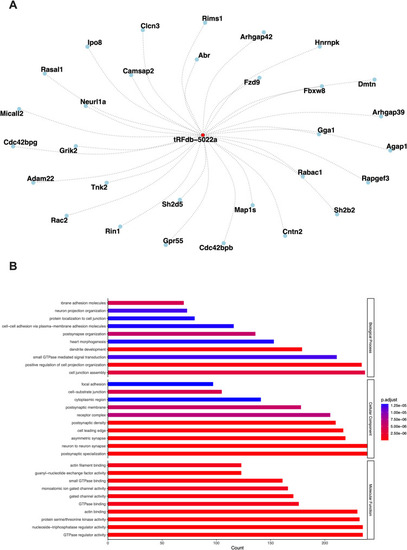
Interaction network and GO analysis of tRF-Glu-CTC target genes. A Network visualization of the top 30 predicted target genes of tRF-Glu-CTC (tRFdb-5022a), generated using the igraph and ggraph packages in R. tRF-Glu-CTC is shown at the center of the network, with its connections (edges) to target genes displayed as dotted lines. B GO enrichment analysis results for the predicted target genes of tRF-Glu-CTC under three classifications: biological process (BP), molecular function (MF), and cellular component (CC). Results indicate significant enrichment of terms associated with neuronal function and synaptic processes

Acknowledgments
This image is the copyrighted work of the attributed author or publisher, and ZFIN has permission only to display this image to its users. Additional permissions should be obtained from the applicable author or publisher of the image. Full text @ J. Mol. Neurosci.