IMAGE

Fig. 1

ID
ZDB-IMAGE-250414-66
Source
Figures for Karacicek et al., 2025
Image
Figure Caption

Fig. 1

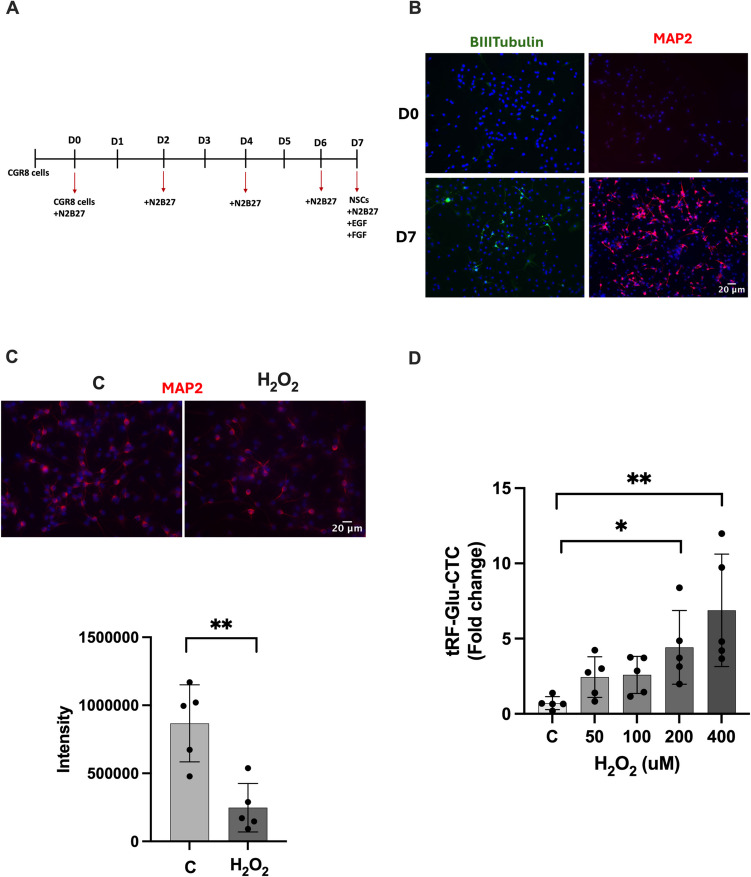
CGR8 neural differention to NSC and the changes of tRF-Glu-CTC level under different H2O2 concentrations. A Differentiation scheme of CGR8 into NSCs. B Immunofluorescence staining of neuronal markers(ßIII-tubulin and MAP2) at 7th day, images were taken 20 × magnification, Olympus IX61 fluorescent microscope). C Immunofluorescence staining of NSCs for neuronal marker (MAP2) after H2O2 exposure (images were taken 40 × magnification, Olympus IX61 fluorescent microscope) and intensity analysis (data are presented as mean ± SD, n = 5, Shapiro–Wilk test, **p < 0.01). D Changes in the levels of tRF-Glu-CTC in NSCs at different H2O2 concentrations (data are presented as mean ± SD, n = 5, one-way ANOVA Dunnett test, *p < 0.05, **p < 0.01)

Acknowledgments
This image is the copyrighted work of the attributed author or publisher, and ZFIN has permission only to display this image to its users. Additional permissions should be obtained from the applicable author or publisher of the image. Full text @ J. Mol. Neurosci.