IMAGE

Fig. 5

ID
ZDB-IMAGE-250414-70
Source
Figures for Karacicek et al., 2025
Image
Figure Caption

Fig. 5

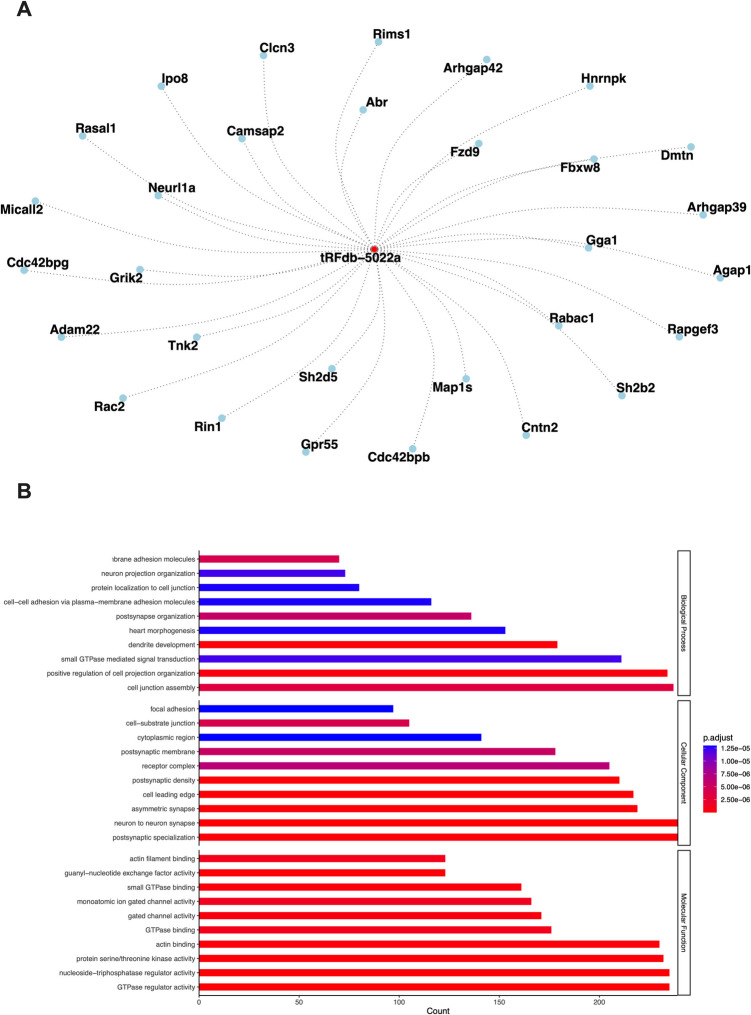
Interaction network and GO analysis of tRF-Glu-CTC target genes. A Network visualization of the top 30 predicted target genes of tRF-Glu-CTC (tRFdb-5022a), generated using the igraph and ggraph packages in R. tRF-Glu-CTC is shown at the center of the network, with its connections (edges) to target genes displayed as dotted lines. B GO enrichment analysis results for the predicted target genes of tRF-Glu-CTC under three classifications: biological process (BP), molecular function (MF), and cellular component (CC). Results indicate significant enrichment of terms associated with neuronal function and synaptic processes

Acknowledgments
This image is the copyrighted work of the attributed author or publisher, and ZFIN has permission only to display this image to its users. Additional permissions should be obtained from the applicable author or publisher of the image. Full text @ J. Mol. Neurosci.