IMAGE

Fig. 4

ID
ZDB-IMAGE-250414-69
Source
Figures for Karacicek et al., 2025
Image
Figure Caption

Fig. 4

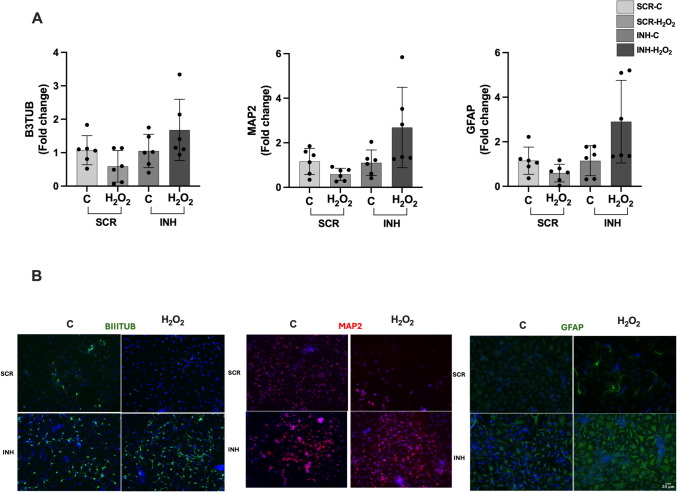
Role of tRF-Glu-CTC inhibition on neurogenesis of NSCs. A Expression levels of neurogenesis markers (ßIII-tubulin, MAP2, and GFAP) after transfection of SCR and tRF-Glu-CTC antisense 2′-OMe-RNA (inhibitor) in 50 μM H2O2 for 6 h for neurogenesis markers (data are presented as mean ± SD, n = 6, t-test, BIIITUB t-test, C-SCR vs. H2O2-SCR p = 0.097 and C-INH vs. H2O2-INH p = 0.171, MAP2 t-test, C-SCR vs. H2O2-SCR p = 0.067 and C-INH vs. H2O2-INH p = 0.054, GFAP t-test, C-SCR vs. H2O2-SCR p = 0.090, C-INH vs. H2O2-INH, Mann–Whitney test p = 0.180). B Immunofluorescence images of neurogenesis markers (ßIII-tubulin, MAP2, and GFAP) after transfection (images were taken 20 × magnification, Olympus IX61 fluorescent microscope). INH, inhibitor; SCR, scramble

Acknowledgments
This image is the copyrighted work of the attributed author or publisher, and ZFIN has permission only to display this image to its users. Additional permissions should be obtained from the applicable author or publisher of the image. Full text @ J. Mol. Neurosci.