IMAGE

Fig. 2

ID
ZDB-IMAGE-250414-67
Source
Figures for Karacicek et al., 2025
Image
Figure Caption

Fig. 2

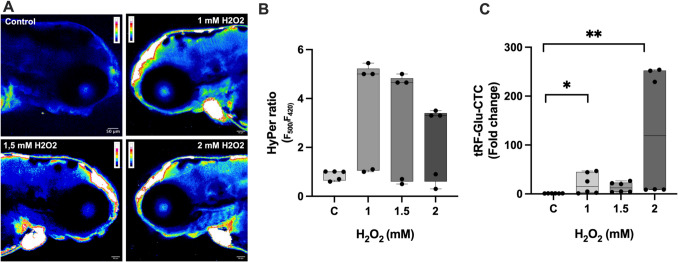
Effect of in vivo HyPer zebrafish H2O2 exposure on tRF-Glu-CTC levels. A H2O2 levels in 72 hpf HyPer zebrafish embryos for 24 h. HyPer imaging for different concentrations of H2O2. The H2O2 levels are inferred from the F500/F420 excitation ratio of HyPer. Respectively, control, 1 mM, 1.5 mM, and 2 mM H2O2. B Quantification of the H2O2 levels in the control and H2O2 concentrations in 72 hpf HyPer zebrafish embryos; images were taken 20 × magnification, Zeiss LSM 880 confocal microscopy (data are presented as boxplot, n = 5, ns, Kruskal–Wallis test, p = 0.168). C Changes in levels of tRF-Glu-CTC fragment in HyPer 72 hpf embryos after 24 h H2O2 exposure (data are presented as boxplot, n = 6, Kruskal–Wallis test, *p < 0.05, **p < 0.01)

Acknowledgments
This image is the copyrighted work of the attributed author or publisher, and ZFIN has permission only to display this image to its users. Additional permissions should be obtained from the applicable author or publisher of the image. Full text @ J. Mol. Neurosci.