
- Title
-
Hormonal dynamics reveal a stimulatory role for secretoneurin in zebrafish ovulation
- Authors
- Peng, D., Lu, C., Spadacini, V., Mitchell, K., Tan, Y., Zhang, D., Levavi-Sivan, B., Hu, W., Trudeau, V.L.
- Source
- Full text @ PNAS Nexus
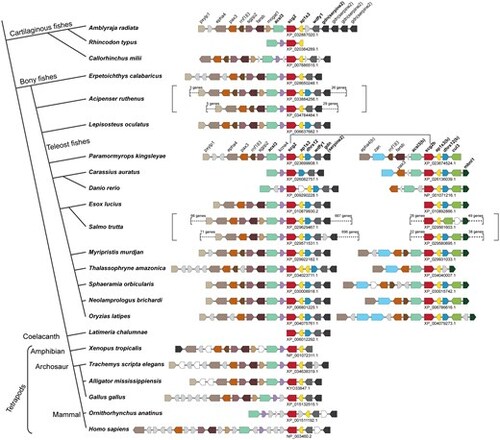
Genome synteny of scg2 homologs from representative jawed vertebrates. The simplified tree topology, adapted based on Fig. S1, is shown on the left side of the figure, whereas their corresponding scg2-containing loci are shown on the right. Each orthologous gene group is represented by an arrowed box highlighted in different colors based on their annotations, shown above the locus. The genes encoding hypothetical proteins are shown in white boxes, noncoding RNAs in the gray boxes, and tRNA genes in triangles. The accession numbers of the scg2 homologs are indicated below the loci. The genome duplication events found in Acipenser ruthenus, ancestor of teleost fishes, and Salmo trutta, determined based on Fig. S2, are indicated by the red dots on the tree (left) and square brackets on the genome synteny (right). Only a part of duplicated regions in A. ruthenus and S. trutta are shown. |
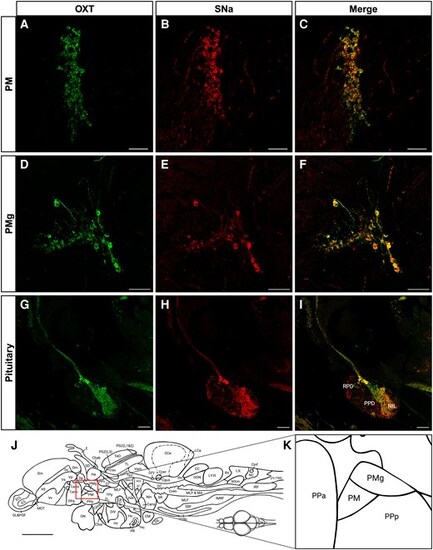
Immunocytochemical localization of Oxt-ir and Scg2a/SNa-ir in female zebrafish. Microscopy imaging of Oxt-ir (green) and Scg2a/SNa-ir (red) preoptic magnocellular (PM; A–C) and gigantocellular (PMg; D–F) regions, and pituitary (G–I). Merged images show colocalization (yellow-orange) of both immunoreactivities in these paraffin sections. RPD, rostral pars distalis; PPD, proximal pars distalis; NIL, neurointermediate lobe. A–F) 20× magnification; G–I) 10× magnification. The position of the PM and PMg relative to the zebrafish forebrain (J), and the PPa and PPa (anterior and posterior parts of parvocellular preoptic nucleus) are shown for reference. Scale bars in A–I = 50 µm. Scale bar in J = 500 µm |

Distribution of Scg2a/SNa-ir in the pituitary of female Tg(lhb-RFP × fshb-eGFP) zebrafish. Confocal microscopy images obtained from cryosections (20 µm) show the distribution of Scg2a/SNa-ir (red), lhb-RFP (cyan blue), and fshb-eGFP (green). The border of the entire pituitary gland is delineated with the white dashed lines, and solid white arrows (D, E, F) indicate cells of interest in magnified images (G, H, I). Optical slices in the horizontal plane (orange line) and vertical plane (purple line) are indicated left and bottom of the panels (G, H, I). Open arrowheads indicate SNa-ir in proximity to but not found in transgenic cells along the x-plane. Solid arrowheads indicate SNa-ir in proximity to but not found in transgenic cells along the y-plane. RPD, rostral pars distalis; PPD, proximal pars distalis; NIL, neurointermediate lobe. Scale bars = 50 µm. |
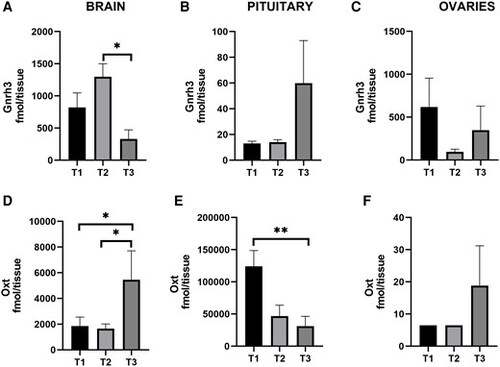
Gnrh3 and Oxt levels during the periovulatory period in brain, pituitary, and ovaries of female zebrafish. The time points represent (T1) 02:00 h, (T2) 05:00 h, and (T3) 08:30 h. Gnrh3 in brain (A), pituitary (B), and ovaries (C). Oxt in brain (D), pituitary (E), and ovaries (F). Results are presented as mean + SEM (n = 10). Note the different scales on the y-axes. The Kruskal–Wallis one-way ANOVA on ranks was performed followed by a Tukey test. *P < 0.05. **P < 0.01. |
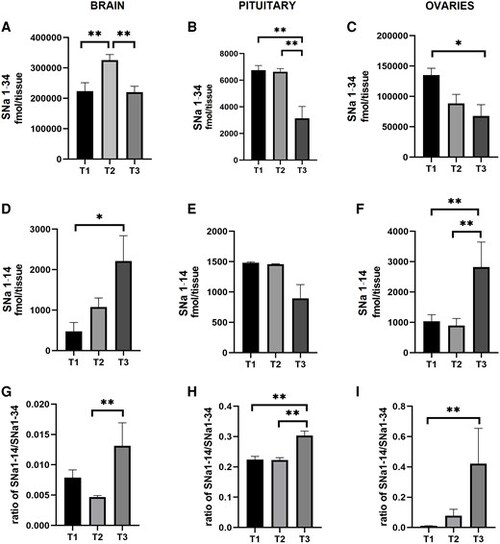
SNa levels vary during the periovulatory period in brain, pituitary, and ovaries of female zebrafish. The time points represent (T1) 02:00 h, (T2) 05:00 h, and (T3) 08:30 h. SNa1–34 in brain (A), pituitary (B), and ovaries (C). SNa1–14 in brain (D), pituitary (E), and ovaries (F). Ratio of SNa1–14 to SNa1–34 in brain (G), pituitary (H), and ovaries (I). Results are presented as mean + SEM (n = 10). Note that the different scales on the y-axes. The Kruskal–Wallis one-way ANOVA on ranks was performed followed by a Tukey test. *P < 0.05. **P < 0.01. |
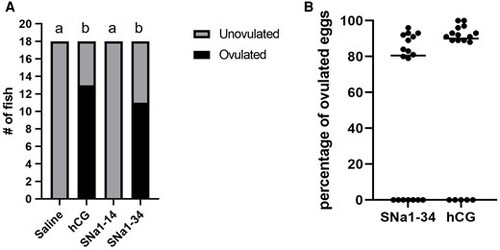
Ovulation of female zebrafish 6 h, following i.p. injection with saline, SNa1–14, SNa1–34, and hCG. A) The number of ovulating females was compared using Fisher’s exact test. Different letters (a, b) above the bars indicate a significant difference (P < 0.01) in the number of ovulated females. B) The percentage of ovulated eggs in female zebrafish injected with SNa1–34 or hCG. Individual levels are depicted along with median values (horizontal line; n = 18); Mann–Whitney U test; P > 0.05. Note that females that did not ovulate are depicted as black dots along the 0 point of the x axis. |
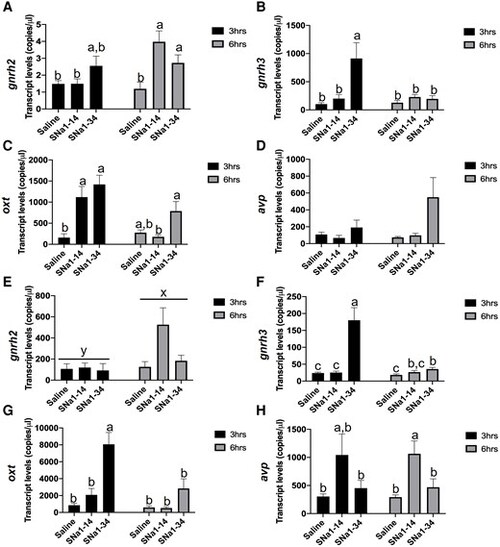
Effects of SNa1–14 and SNa1–34 on reproductive neuropeptide in telencephalon (A–D) and hypothalamus (E–H) in female zebrafish. Telencephalon expression of gnrh2 (A), gnrh3 (B), oxt (C), avp (D), and hypothalamus expression of gnrh2 (E), gnrh3 (F), oxt (G), and avp (H) are presented (mean + SEM; n = 8). In E), the different superscripts (x, y) indicate a significant main effect of time (F = 10.14, P = 0.015). In other panels, means with different letters (a, b) indicate a significant difference (two-way ANOVA; P < 0.05). |
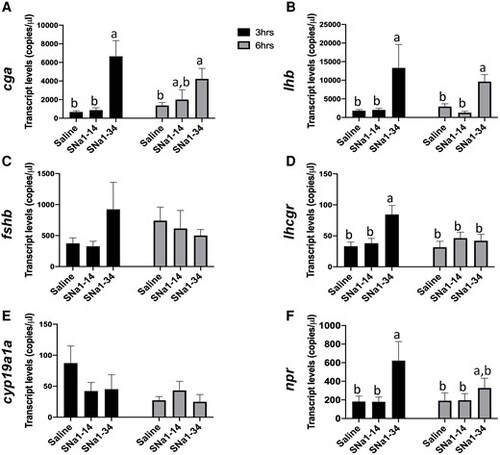
Effects of SNa1–14 and SNa1–34 injection on reproduction-related gene expressions in pituitary (A–C) and ovary (D–F) in female zebrafish. Transcript levels of cga (A), lhb (B), and fshb (C) in pituitary and levels of lhcgr (D), cyp19a1a (E), and npr (F) in ovary are presented (mean + SEM; n = 8). Means with different letters (a, b) indicate a significant difference (two-way ANOVA; P < 0.05). |

Summary of key findings and working model for the role of SNa1–34 in female zebrafish reproduction. Prohormone convertases selectively process the Scg2a precursor protein to the bioactive peptide SNa1–34. Immunocytochemistry revealed SNa and OXT are colocalized in preoptic neurons. We found that SNa + OXT neurons project to the neurointermediate lobe in the posterior pituitary. While direct evidence is still scant, localization of SNa and OXT in nerve terminals implies release into the circulation, where the peptides may influence ovulation and spawning. Some neuronal fibers immunoreactive for SNa but not OXT entered the proximal pars distalis (anterior pituitary). Regression analysis revealed that SNa1–34 (SNa on the figure) and Gnrh3 peptide levels in the brain increase concomitantly at the time of the Lh surge. In the pituitary, SNa1–34 peptide levels are highest prior to ovulation. Experimental data demonstrated that 3 h following i.p. injection of synthetic SNa1–34 increases mRNA levels for gnrh3 in the hypothalamus, lhb and cga in the pituitary, and lhcgr and npr in the ovary. These are key indicators of activation of genes at each level of the HPG axis that led to ovulation 6 h after a single SNa1–34 injection. SNa1–34 can enhance Lh cell activity through a neuroendocrine pathway (i) and by stimulating Gnrh3 neurons (ii). This model is supported by previous observations in mutant lines (27), where it was demonstrated that hypothalamic gnrh3, and pituitary lhb and cga are lower in scg2a-/- females compared with wild type. In the same mutant line, SNa1–34 injection in the subfertile scg2a-/-; scg2b-/- double mutant zebrafish enhanced spawning by ∼3-fold, like the effects of the Lh analog hCG in the same line (27). |