
Fig. 1
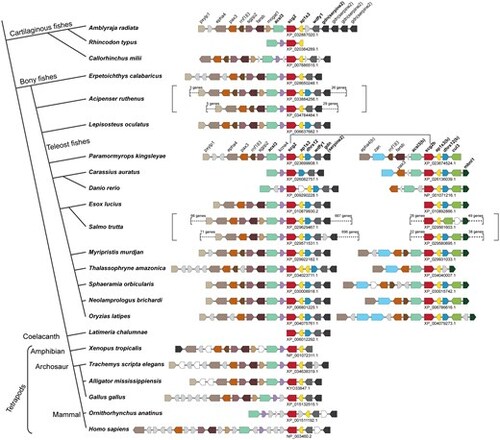
Genome synteny of scg2 homologs from representative jawed vertebrates. The simplified tree topology, adapted based on Fig. S1, is shown on the left side of the figure, whereas their corresponding scg2-containing loci are shown on the right. Each orthologous gene group is represented by an arrowed box highlighted in different colors based on their annotations, shown above the locus. The genes encoding hypothetical proteins are shown in white boxes, noncoding RNAs in the gray boxes, and tRNA genes in triangles. The accession numbers of the scg2 homologs are indicated below the loci. The genome duplication events found in Acipenser ruthenus, ancestor of teleost fishes, and Salmo trutta, determined based on Fig. S2, are indicated by the red dots on the tree (left) and square brackets on the genome synteny (right). Only a part of duplicated regions in A. ruthenus and S. trutta are shown. |