
FIGURE
Fig. 4
Fig. 4
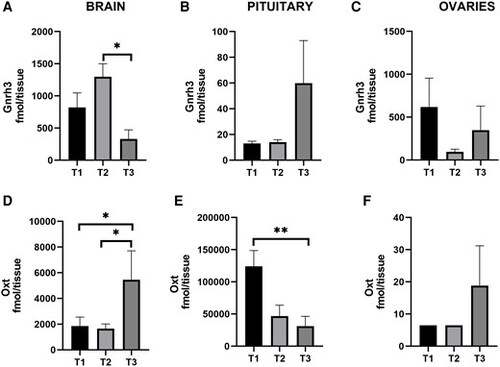
Gnrh3 and Oxt levels during the periovulatory period in brain, pituitary, and ovaries of female zebrafish. The time points represent (T1) 02:00 h, (T2) 05:00 h, and (T3) 08:30 h. Gnrh3 in brain (A), pituitary (B), and ovaries (C). Oxt in brain (D), pituitary (E), and ovaries (F). Results are presented as mean + SEM (n = 10). Note the different scales on the y-axes. The Kruskal–Wallis one-way ANOVA on ranks was performed followed by a Tukey test. *P < 0.05. **P < 0.01. |
Expression Data
Expression Detail
Antibody Labeling
Phenotype Data
Phenotype Detail
Acknowledgments
This image is the copyrighted work of the attributed author or publisher, and
ZFIN has permission only to display this image to its users.
Additional permissions should be obtained from the applicable author or publisher of the image.
Full text @ PNAS Nexus