
FIGURE
Fig. 8
Fig. 8
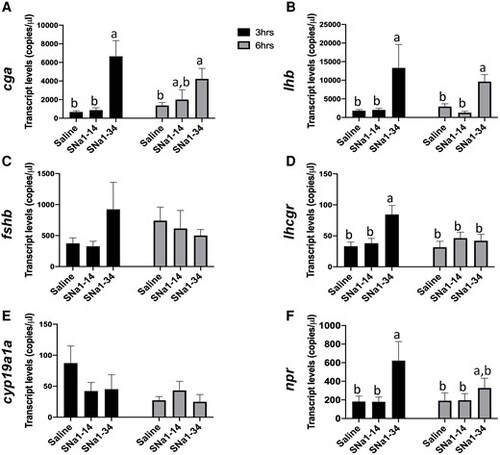
Effects of SNa1–14 and SNa1–34 injection on reproduction-related gene expressions in pituitary (A–C) and ovary (D–F) in female zebrafish. Transcript levels of cga (A), lhb (B), and fshb (C) in pituitary and levels of lhcgr (D), cyp19a1a (E), and npr (F) in ovary are presented (mean + SEM; n = 8). Means with different letters (a, b) indicate a significant difference (two-way ANOVA; P < 0.05). |
Expression Data
Expression Detail
Antibody Labeling
Phenotype Data
Phenotype Detail
Acknowledgments
This image is the copyrighted work of the attributed author or publisher, and
ZFIN has permission only to display this image to its users.
Additional permissions should be obtained from the applicable author or publisher of the image.
Full text @ PNAS Nexus