
FIGURE
Fig. 6
Fig. 6
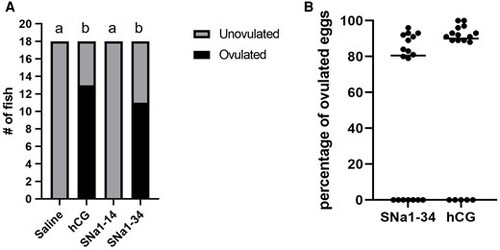
Ovulation of female zebrafish 6 h, following i.p. injection with saline, SNa1–14, SNa1–34, and hCG. A) The number of ovulating females was compared using Fisher’s exact test. Different letters (a, b) above the bars indicate a significant difference (P < 0.01) in the number of ovulated females. B) The percentage of ovulated eggs in female zebrafish injected with SNa1–34 or hCG. Individual levels are depicted along with median values (horizontal line; n = 18); Mann–Whitney U test; P > 0.05. Note that females that did not ovulate are depicted as black dots along the 0 point of the x axis. |
Expression Data
Expression Detail
Antibody Labeling
Phenotype Data
Phenotype Detail
Acknowledgments
This image is the copyrighted work of the attributed author or publisher, and
ZFIN has permission only to display this image to its users.
Additional permissions should be obtained from the applicable author or publisher of the image.
Full text @ PNAS Nexus