
|
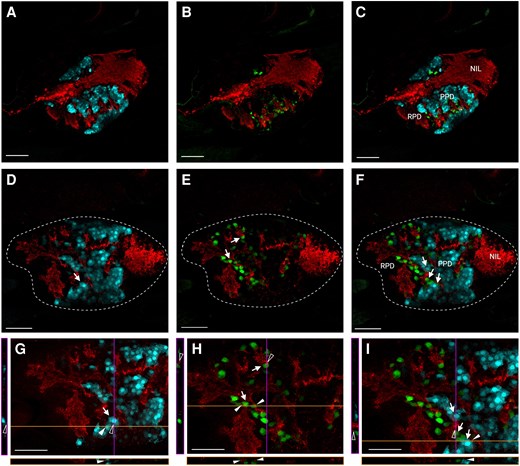
Fig. 3 Distribution of Scg2a/SNa-ir in the pituitary of female Tg(lhb-RFP × fshb-eGFP) zebrafish. Confocal microscopy images obtained from cryosections (20 µm) show the distribution of Scg2a/SNa-ir (red), lhb-RFP (cyan blue), and fshb-eGFP (green). The border of the entire pituitary gland is delineated with the white dashed lines, and solid white arrows (D, E, F) indicate cells of interest in magnified images (G, H, I). Optical slices in the horizontal plane (orange line) and vertical plane (purple line) are indicated left and bottom of the panels (G, H, I). Open arrowheads indicate SNa-ir in proximity to but not found in transgenic cells along the x-plane. Solid arrowheads indicate SNa-ir in proximity to but not found in transgenic cells along the y-plane. RPD, rostral pars distalis; PPD, proximal pars distalis; NIL, neurointermediate lobe. Scale bars = 50 µm.