
- Title
-
Inhibition of COX2 impairs angiogenesis and causes vascular defects in developing zebrafish embryos
- Authors
- Pillai, L., Nesari, V., Danes, D., Balakrishnan, S.
- Source
- Full text @ Int. J. Dev. Biol.
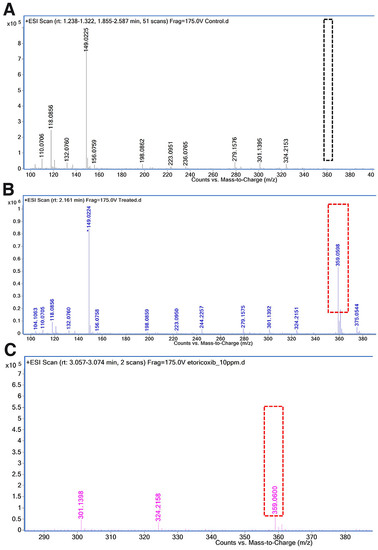
Representative liquid chromatography-tandem mass spectrometry (LC-MS/MS) profile. (A) Control group. (B) Treated group. (C) Etoricoxib pure compound (Standard Solution). The etoricoxib fragment of M.W. (359) has been highlighted in a red dotted rectangle. A black dotted rectangle shows the absence of the corresponding peak. |
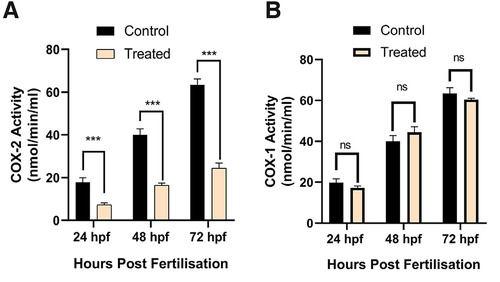
Cyclooxygenase (COX) enzyme activity levels. (A) COX2 activity. (B) COX1 activity in zebrafish embryos of control and treated group at 24, 48 and 72 hpf stages. ***p ≤ 0.001; ns, non-significant; n=3, N=50. |
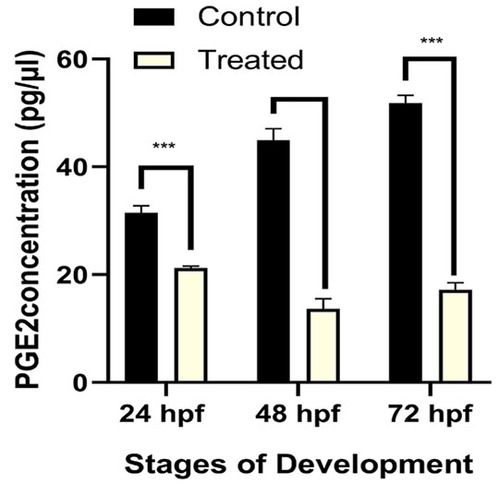
ProstaglandinE2 (PGE2) estimation in zebrafish embryos of control and treated group. The assayed stages are 24, 48 and 72 hpf. ***p ≤ 0.001; n=3, N=50. |
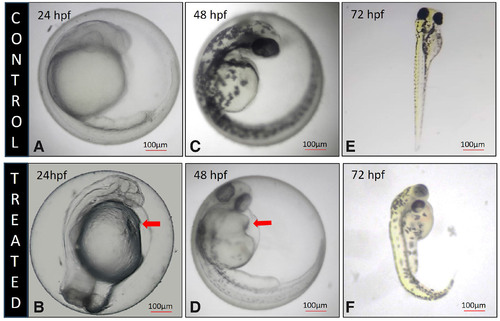
Morphology of 24, 48 and 72 hpf zebrafish larva. (A,C,E) Control zebrafish larva, displaying heart. (B,D,F) Etoricoxib treated zebrafish larva, showing pericardial edema in the heart (red arrow). |
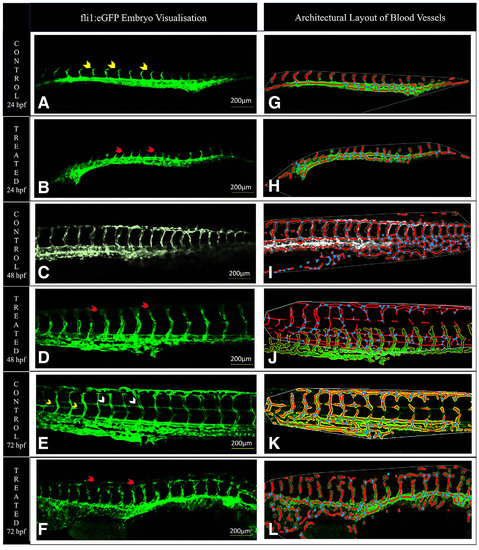
Confocal images of the fli1: eGFP transgenic line. (A) Control 24 hpf embryos (yellow arrowhead indicates angiogenic sprouts). (B) Treated 24 hpf embryos (red arrowhead indicates shrunken angiogenic sprouts). (C) Control 48 hpf; yellow arrowhead indicates DLAV (dorsal longitudinal anastomotic vessel). (D) Treated 48 hpf embryos (yellow arrowhead indicates the extension of angiogenic sprouts). (E) Control 72 hpf larvae (white arrowhead showing PAV (parachordal vessel) and red arrowhead showing VTA (primordial vertebral artery). (F) Treated 72 hpf larvae (red arrowhead indicates the delayed established DLAVs). 2nd column (G-L): Architectural layout of the vascular network processed on AngioTool software. |
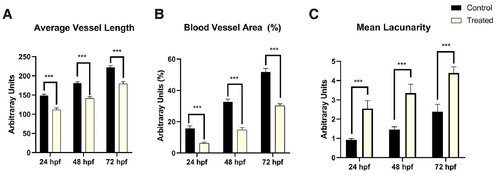
Analysis of vasculature of fli1:eGFP embryos using AngioTool software. The stages of assessment are 24, 48 and 72 hpf. (A) Average blood vessel length. (B) Blood vessel area (%). (C) Mean lacunarity. ***p ≤ 0.001; n=3, N=50. |

Mean fold change in the expression of the genes involved during angiogenesis in etoricoxib treated zebrafish embryos. (A) 24 hpf, (B) 48 hpf and (C) 72 hpf stages. The fold change value for the control group was kept as 1. ns, not significant, *p ≤ 0.1 and **p ≤ 0.01; n = 3; N=75. |
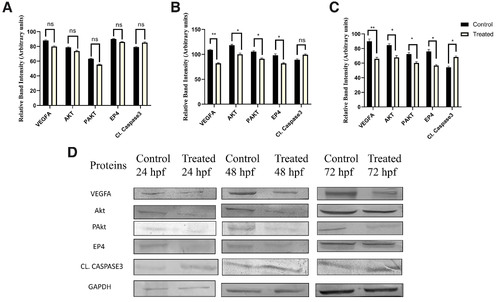
Protein Expression Analysis. (A-C) Densitometric analysis of proteins involved during angiogenesis in control and etoricoxib treated zebrafish embryos. The stages of assessment were (A) 24 hpf, (B) 48 hpf and (C) 72 hpf. ns, not significant, *p ≤ 0.1 and **p≤0.01. n = 3; N=75. (D) Representative Western blot images of the corresponding stages. |
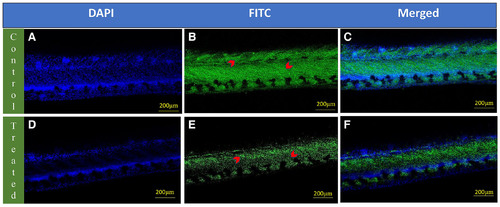
Whole-mount localization of vascular endothelial growth factor A (VEGFA) in the intersegmental vessels of 72 hpf zebrafish larvae. The upper panel (A-C) shows images of control zebrafish larvae: (A) Nuclei stained with DAPI (blue), (B) VEGFA immunolabeling visualized using FITC (green), with red arrowheads indicating VEGFA expression in the intersegmental blood vessels and (C) merged image combining DAPI and VEGFA signals. The lower panel (D–F) shows images of etoricoxib-treated zebrafish larvae: (D) Nuclei stained with DAPI (blue), (E) VEGFA immunolabeling visualized using FITC (green), with red arrowheads indicating VEGFA expression in the intersegmental blood vessels and (F) merged image combining DAPI and VEGFA signals. |