
Image
|
Figure Caption
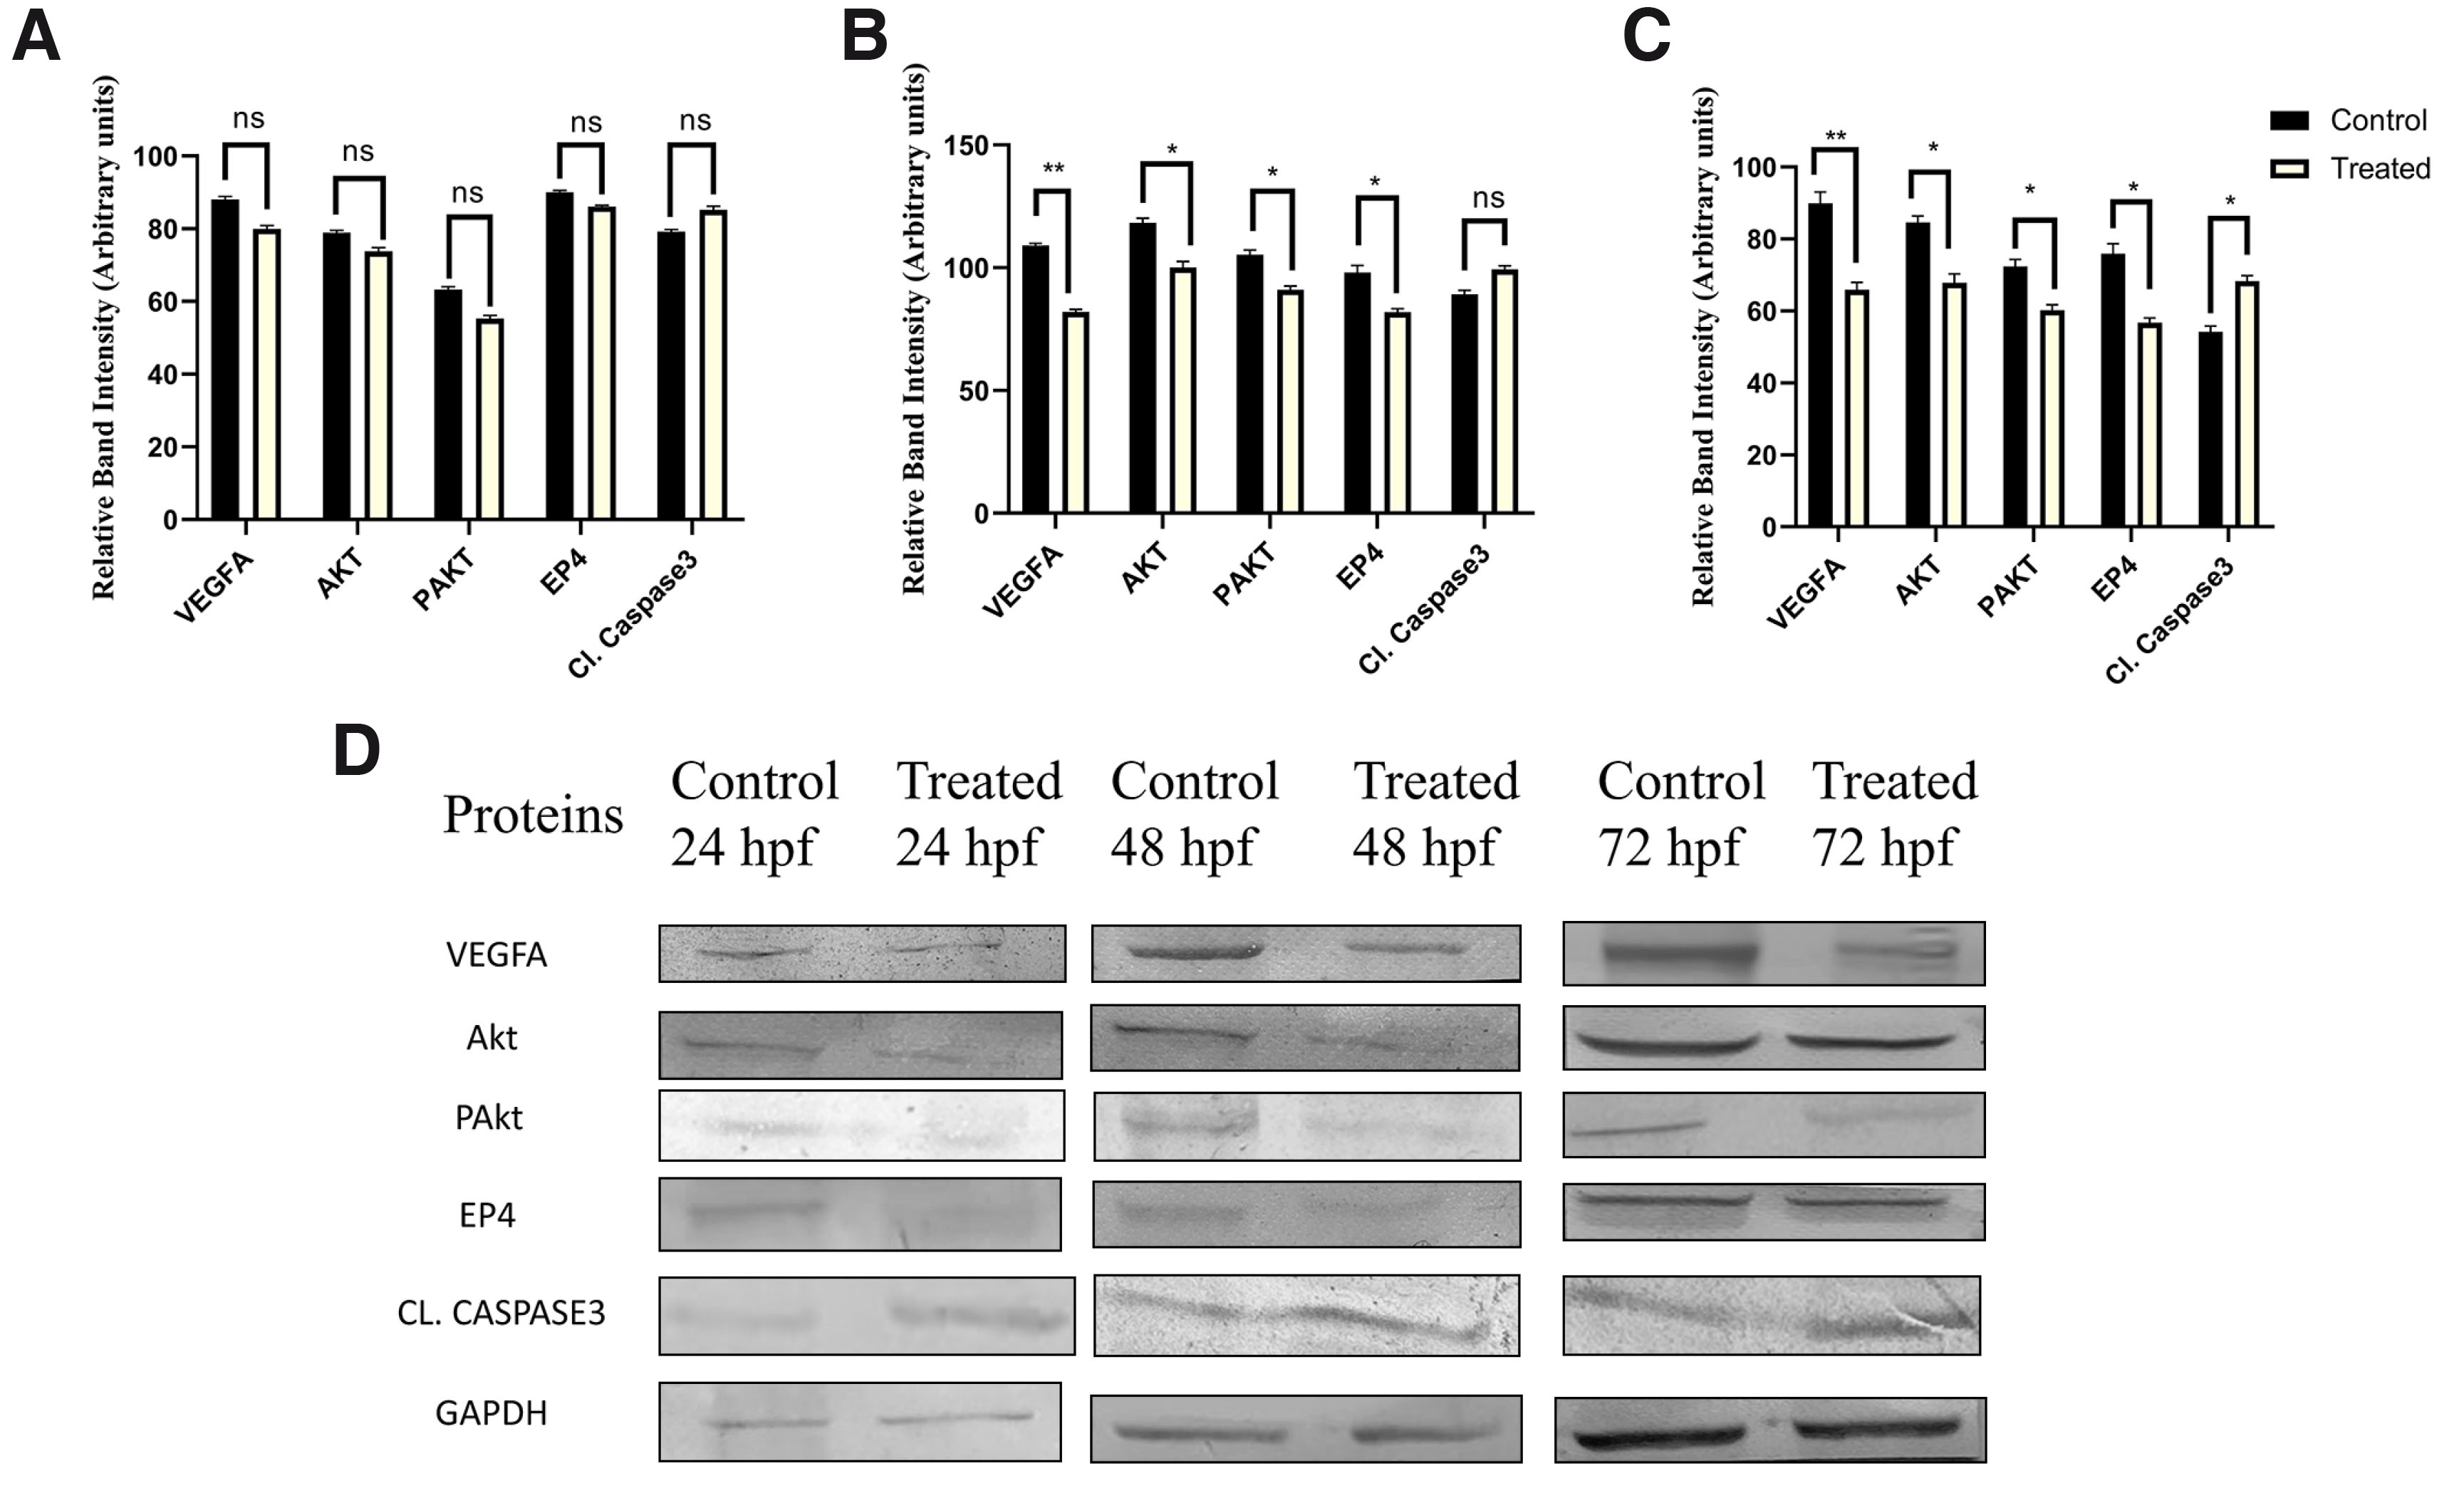
Fig. 8 Protein Expression Analysis. (A-C) Densitometric analysis of proteins involved during angiogenesis in control and etoricoxib treated zebrafish embryos. The stages of assessment were (A) 24 hpf, (B) 48 hpf and (C) 72 hpf. ns, not significant, *p ≤ 0.1 and **p≤0.01. n = 3; N=75. (D) Representative Western blot images of the corresponding stages.
Acknowledgments
This image is the copyrighted work of the attributed author or publisher, and
ZFIN has permission only to display this image to its users.
Additional permissions should be obtained from the applicable author or publisher of the image.
Full text @ Int. J. Dev. Biol.