
FIGURE
Fig. 2
Fig. 2
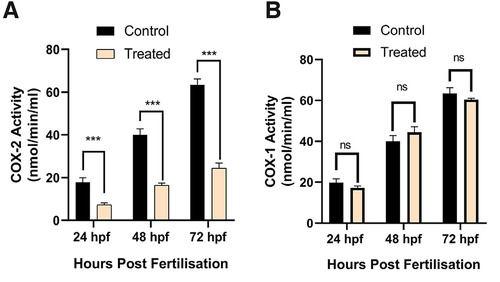
Cyclooxygenase (COX) enzyme activity levels. (A) COX2 activity. (B) COX1 activity in zebrafish embryos of control and treated group at 24, 48 and 72 hpf stages. ***p ≤ 0.001; ns, non-significant; n=3, N=50. |
Expression Data
Expression Detail
Antibody Labeling
Phenotype Data
Phenotype Detail
Acknowledgments
This image is the copyrighted work of the attributed author or publisher, and
ZFIN has permission only to display this image to its users.
Additional permissions should be obtained from the applicable author or publisher of the image.
Full text @ Int. J. Dev. Biol.