
Image
|
Figure Caption
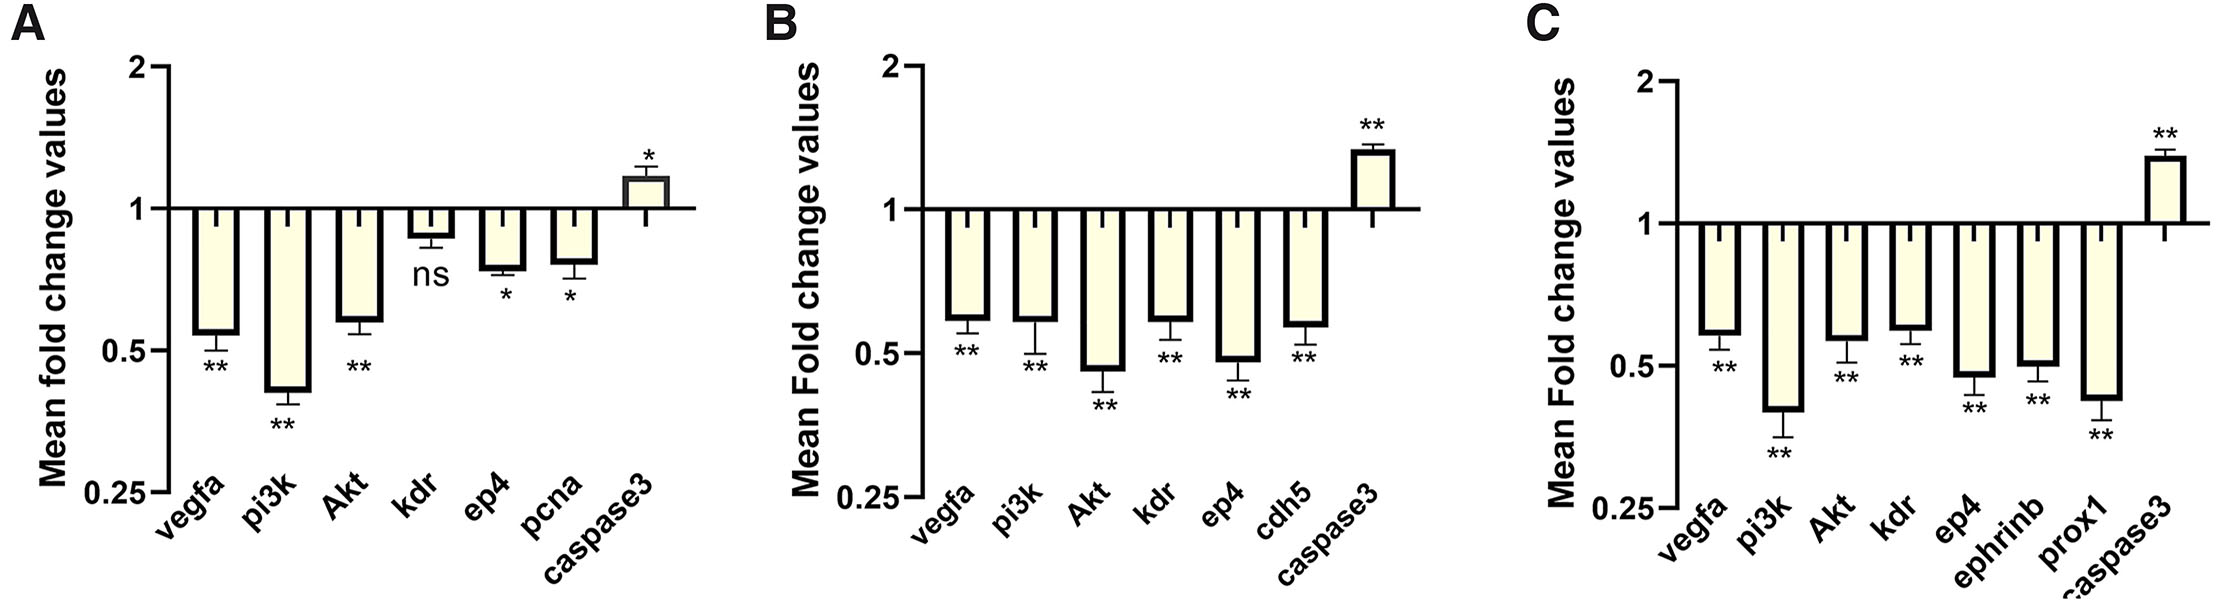
Fig. 7 Mean fold change in the expression of the genes involved during angiogenesis in etoricoxib treated zebrafish embryos. (A) 24 hpf, (B) 48 hpf and (C) 72 hpf stages. The fold change value for the control group was kept as 1. ns, not significant, *p ≤ 0.1 and **p ≤ 0.01; n = 3; N=75.
Acknowledgments
This image is the copyrighted work of the attributed author or publisher, and
ZFIN has permission only to display this image to its users.
Additional permissions should be obtained from the applicable author or publisher of the image.
Full text @ Int. J. Dev. Biol.