
FIGURE
Fig. 6
Fig. 6
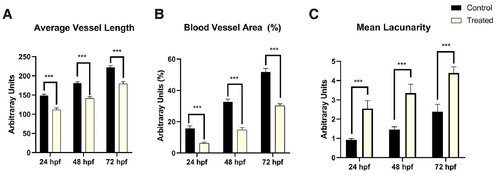
Analysis of vasculature of fli1:eGFP embryos using AngioTool software. The stages of assessment are 24, 48 and 72 hpf. (A) Average blood vessel length. (B) Blood vessel area (%). (C) Mean lacunarity. ***p ≤ 0.001; n=3, N=50. |
Expression Data
Expression Detail
Antibody Labeling
Phenotype Data
Phenotype Detail
Acknowledgments
This image is the copyrighted work of the attributed author or publisher, and
ZFIN has permission only to display this image to its users.
Additional permissions should be obtained from the applicable author or publisher of the image.
Full text @ Int. J. Dev. Biol.