FIGURE SUMMARY
Title

Patient-specific mutation of a contact site protein Tomm70 causes neurodegeneration in a zebrafish model

Authors
Garg, V., Heinrich, R., Perera, R.P., Ischebeck, T., Möbius, W., Ruhwedel, T., Scholz, P., Salinas, G., Dullin, C., Göpfert, M.C., Engelmann, J., Dosch, R., Geurten, B.R.H.
Source
Full text @ Dis. Model. Mech.

Mutation leads to the absence of Tomm70 from axons. The cultured brain neurons of wild-type (wt) and tomm70 mutant female fish were stained with DAPI (representing nucleus; blue), anti-β-Tubulin antibody (a neuronal marker) (green) and anti-Tomm70 antibody (red). The brightness of images was corrected using ImageJ. (A) The diagram represents four different categories of staining observed during imaging and quantification of the wt and tomm70 mutant brain cultured neurons stained with anti-Tomm70 antibody. Categories 1, 2, 3 and 4 depict the location of the signal for Tomm70 in the neurons. (B-E) Representative images of each category of Tomm70 staining in neurons. Scale bars: 30 µm. (B) wt fish showing signal for Tomm70 both in the soma and axon (category 4). (C) tomm70 fish showing signal for Tomm70 only in the soma (category 1). (D) tomm70 fish showing signal for Tomm70 in the soma and in the initial part of the axon (category 2). (E) tomm70 fish showing signal for Tomm70 in the soma and half way along the axon (category 3). The white-line box in the wide-field column highlights the specific region magnified in the adjacent close-up column. White arrows in the mutants for both β-Tubulin and Tomm70 staining indicate identical locations, underscoring the absence of Tomm70 in these areas. (F) Quantification representing the percentage of neuronal staining in four different categories for wt and mutants. More than 80% of the neuronal staining in wt was classified as category 4. Conversely, in the mutants, there was a significantly higher percentage of neuronal staining in categories 1, 2 and 3, and a significantly lower percentage of neuronal staining in category 4. (G) Quantification of the percentage of neuronal staining in categories 1-3 together, and for category 4, in wt and mutant fish. There is a significant increase in the percentage of neuronal staining in categories 1-3 in mutants compared to wt. Number of fish (N)=9 (wt) and 7 (−/−); total number of neurons counted (n)=191 (wt) and 146 (−/−). Error bar represents 95% c.i. Statistical significance was tested using Fisher's permutation test. *P<0.05 and ***P<0.001. ‘−/−’ in this and other figures refers to Danio rerio Tomm70Ile525Thr mutants, which possess a missense mutation, not a null mutation.

Mutation impacts the transport of mitochondria to the axons. The cultured brain neurons of wt and tomm70 mutant female fish were stained with DAPI (representing nucleus; blue), anti-β-Tubulin antibody (a neuronal marker; green), anti-Tomm70 antibody (red) and anti-Cytochrome c antibody (a conserved mitochondrial marker; cyan). The brightness of images was corrected using ImageJ. (A,B) Representative pictures of neuronal staining of wt (A) and mutant (B) fish with anti-β-Tubulin, anti-Tomm70 and anti-Cytochrome c antibodies. The white-line box in the wide-field column highlights the specific region magnified in the adjacent close-up column. White arrows in the mutants for β-Tubulin, Tomm70 and Cytochrome c staining indicate identical locations, underscoring the absence of Tomm70 and presence of Cytochrome c in these areas. Scale bars: 30 µm. (C) Quantification of the percentage of neuronal staining showing signal for Cytochrome c in the axons in wt and tomm70 mutants. Quantifications for Tomm70 signals are shown in Fig. 1G. N=4 (wt) and 3 (−/−); n=66 (wt) and 53 (−/−). Error bar represents 95% c.i. Statistical significance was tested using Fisher's permutation test. ns, non-significant.

Mutation influences the transport of mitochondria to the dendrites. The cultured brain neurons of wt and tomm70 mutant female fish were stained with DAPI (representing nucleus; blue), anti-β-Tubulin antibody (a neuronal marker; green), anti-Tomm70 antibody (red) and anti-Cytochrome c antibody (a conserved mitochondrial marker; cyan). The brightness of images was corrected using ImageJ. (A,B) Representative pictures of multi-polar neuronal staining of wt (A) and mutant (B) fish with anti-β-Tubulin, anti-Tomm70 and anti-Cytochrome c antibodies. The white-line box in the wide field column highlights the specific region magnified in the adjacent close-up column. White arrows in the mutants for β-Tubulin, Tomm70 and Cytochrome c staining indicate identical locations, underscoring the absence of Tomm70 and presence of Cytochrome c in all the neurites. Scale bars: 30 µm. (C) Quantification of the percentage of neuronal staining showing a signal for Tomm70 in neurites in wt and mutants. (D) Quantification of the percentage of neuronal staining showing a signal for Cytochrome c in neurites in wt and mutants. N=9 (wt) and 7 (−/−) for Tomm70, and N=4 (wt) and 3 (−/−) for Cytochrome c; n=29 (wt) and 32 (−/−) for Tomm70, and n=15 (wt) and 20 (−/−) for Cytochrome c. Error bar represents 95% c.i. Statistical significance was tested using Fisher's permutation test. **P<0.01; ns, non-significant.

Myelin pathology in the large calibre axons of the spinal cord of tomm70 mutants. (A) Representative electron microscopy picture showing large calibre axons in the cranial part of the spinal cord with intact myelin in wt fish. (B) Orange arrowheads mark points of severe splitting of myelin sheath in the large calibre axons of the cranial part of the spinal cord in homozygous mutants. (C) Quantification of severe split events of myelin per 1000 µm2 area in wt and tomm70 mutant fish. There is a significant increase in the number of severe splitting cases in the cranial part of the spinal cord in mutants compared to wt. (D) Another electron micrograph showing intact myelin in the large calibre axons of the cranial part of the spinal cord in wt fish. (E) Orange arrowheads mark points of vesiculation of the myelin sheath surrounding the large calibre axons of the cranial part of the spinal cord in tomm70 mutant fish. (F) Quantification of vesiculation events of the myelin sheath per 1000 µm2 area in wt and mutant fish. Although there is a slight increase in the number of cases of vesiculation in mutants in the large calibre axons of the cranial part of spinal cord, it is not changed significantly compared to that in wt. N=2 (wt) and 5 (−/−). Error bar represents 95% c.i. Statistical significance was tested using Fisher's permutation test. **P<0.01; ns, non-significant. Scale bars: 2500 nm.

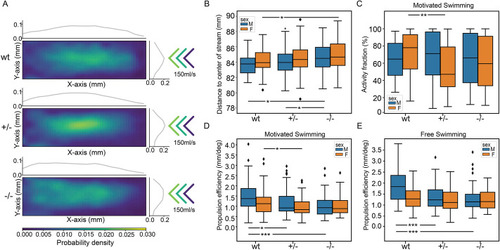
Locomotion defects in tomm70 mutant fish. (A) Two-dimensional heat map with marginal histogram showing all possible locations of female fish in the setup. Blue represents low location probability; yellow represents high location probability. Although wt and heterozygous mutant female fish remain in the centre of the stream, the homozygous female mutants avoid it and reside at a longer distance from the centre of the stream. (B) Box plot of mean distance of fish to the centre of stream, propulsion efficiency and activity fraction. The black line represents the median of all individuals, the box displays the upper and lower quartiles, the whiskers denote 1.5 times the interquartile distance, and the diamonds mark outliers. There is a significant increase in the mean distance of homozygous mutant male and female fish from the centre of stream compared to that for their wt counterparts. (C) Activity is defined as the percentage of video frames in which swimming velocity exceeded 0.025 m/s. Decrease in the activity of heterozygous and homozygous female fish compared to that of female wt fish was observed during motivated swimming trials. There is no change in the activity fraction of male mutants. The activity fraction is normalised to the time period of recording the activity of the fish, which is 30 s for motivated swimming. (D,E) Reduction in the propulsion efficiency of heterozygous and homozygous mutant males and females compared to that of wt males and females in motivated (D) and free-swimming (E) trials. Propulsion efficiency is defined as the number of bends produced by the fish per distance covered in a given time period. N=59 (female wt), 150 (female +/−) and 65 (female −/−), and N=46 (male wt), 91 (male +/−) and 84 (male −/−), in free-swimming trials; N=59 (female wt), 150 (female +/−) and 66 (female −/−), and N=45 (male wt), 96 (male +/−) and 81 (male −/−), in motivated swimming trials; and female N=45 (female wt), 91 (female +/−) and 57 (female −/−), and male N=46 (male wt), 60 (male +/−) and 75 (male −/−), in counter-current trials. Statistical significance was tested using Fisher's permutation test. *P<0.05, **P<0.01, ***P<0.001.

Impact of Tomm70Ile525Thr mutation on C-start escape response dynamics. (A-C) The progression of movement traces and associated kinematic parameters for wt (A), heterozygous (B) and homozygous (C) mutant female zebrafish are illustrated during electrophysiological assessments. The top row presents sequential outlines of the zebrafish at 25 ms intervals, with the colour gradient corresponding to the adjacent colour bar. To emphasise the critical segment of the response, the 2 s window surrounding stimulus delivery (indicated by the grey dashed line on the colour bar) is rendered with increased opacity compared to the period 1-4 s after stimulus delivery. Scale bars: 10 mm. In the bottom row, large neural activity spikes are represented in a raster plot format, and the thrust magnitude and instantaneous spike frequency are depicted in the line graph beneath. The point of stimulus initiation is consistently marked by a grey dashed line for temporal orientation. (D-F) Box plots summarise spike latency (D), spike count (E) and median curvature amplitude (F). Black line denotes the median, the box denotes the interquartile range, whiskers extend to 1.5 times the interquartile range, and diamonds mark outliers. (D) Marked escalation in spike latency in heterozygous and homozygous female mutants relative to their wt female counterparts, with homozygous mutants displaying greater latency than heterozygous mutants. Analogous trends are noted in male mutants, with a notable reduction in spike latency for heterozygous males versus wt males. (E) Decrement in spike count for heterozygous and homozygous female mutants compared to that of female wt fish. (F) Reduction in median curvature amplitude for mutant females, with similar patterns observed in mutant males compared to that of their wt heterozygous counterparts. N=49 (female wt), 94 (female +/−) and 58 (female −/−), and N=42 (male wt), 56 (male +/−) and 74 (male −/−). Statistical assessments were performed using Fisher's permutation test. *P<0.05, **P<0.01, ***P<0.001.

Acknowledgments
This image is the copyrighted work of the attributed author or publisher, and ZFIN has permission only to display this image to its users. Additional permissions should be obtained from the applicable author or publisher of the image. Full text @ Dis. Model. Mech.