
- Title
-
Unsupervised spatiotemporal classification of deformation patterns of embryonic tissues matches their fate map
- Authors
- Pastor-Escuredo, D., Lombardot, B., Savy, T., Boyreau, A., Doursat, R., Goicolea, J.M., Santos, A., Bourgine, P., Del Álamo, J.C., Ledesma-Carbayo, M.J., Peyriéras, N.
- Source
- Full text @ iScience
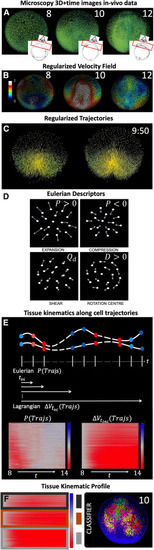
Construction of the biomechanical map from the reconstructed cell lineage (A–C) WT specimen wt1 imaged live between 6 and 12 hpf, animal pole (AP) view, rendered in 3D using the Mov-IT software. Scale bar 50 . (A) Nuclear staining (green) shown at 8, 10 and 12 hpf as indicated in each panel. The insets depict the imaged volume and field of view. (B) Cell velocity magnitudes obtained from the cells’ regularized displacement field (see STAR Methods, Figure S2) and represented in as indicated by color bar. (C) Original cell trajectories (left panel) vs. regularized ones (right panel). Cell nuclei are shown as cubes and 5-time-step segments of their trajectories are shown by lines. (D) Schematics of simple cell flows, associated tissue deformation patterns, and corresponding IDG descriptors: expansion ( ), compression (), shear (), and rotation ( ). (E) Schematic illustration depicting the computation of tissue kinematics descriptors along cell trajectories. Tissue deformation invariants are computed at each point along the cell trajectories from the instantaneous (Eulerian) or finite time (Lagrangian) deformation gradients (e.g., and , respectively, where red indicates compression and blue indicates expansion blue). The resulting time-dependent profiles are plotted for a selection of cells between 8 ( ) and 14 hpf, leading to an atlas of tissue kinematics maps along cell trajectories. (F) Overview of the two-step clustering approach used to identify embryonic domains undergoing distinct tissue kinematics. First, we cluster each map within the atlas to identify representative tissue kinematics profiles (RTKPs, dark gray, brown, light gray). Second, the RTKPs are used to classify cells within the embryo, revealing connected embryonic domains that experience distinct spatiotemporal evolution of tissue kinematics (red, magenta, green and yellow). |
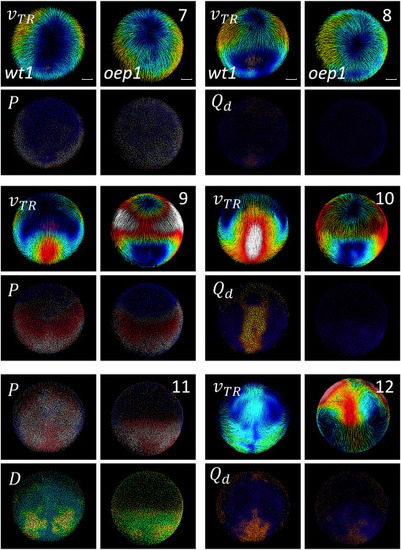
Biomechanical landmarks of gastrulationin wt and zoeptz57/tz57 Comparison between a wild-type embryo wt1 (columns 1 and 3) and a zoeptz57/tz57 mutant embryo oep1 (columns 2 and 4). Time point (7, 8, 9, 10, 11 and 12 hpf) indicated to right. Descriptor indicated top left of each pair (wt1 and oep1) of panels. Velocity field ( ) colormap from dark (zero) to white (2 ). colormap goes from compression (red) to neutral (gray) to expansion (blue). colormap from dark (no distortion) to bright (maximum distortion). Rotation discriminant colormap from blue (no rotation) to green-yellow (maximum rotation observed). Scale bar 50 . |
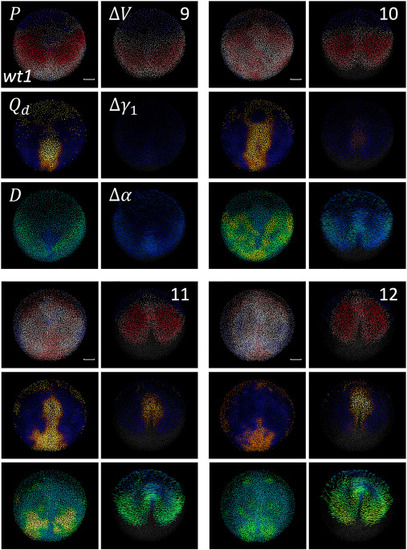
Cumulative descriptors of wt development Comparison between Eulerian and Lagrangian descriptors for wild-type embryo wt1 at four time points during gastrulation (9, 10, 11 and 12 hpf, as shown at the top right corner of each panel group). The deformation descriptors shown are P, , and from left to right and from top to bottom, as indicated in the top left panel group. Lagrangian (, and ) and Eulerian (, , ) descriptors are juxtaposed in the left and right columns of each panel group, respectively. Lagrangian descriptors use the following color schemes: colormap from compression (red) to neutral (gray) to expansion (blue); colormap from dark (no distortion) to bright (maximum distortion); colormap from blue (no rotation) to green-yellow (maximum rotation). Eulerian descriptors use the following color schemes: colormap from compression (red) to neutral (gray) to expansion (blue); from dark (no distortion) to bright (maximum distortion); colormap goes from blue (no rotation) to green-yellow (maximum rotation). Scale bar 50 . |

Quantitative comparison of Lagrangian Kinematic Profiles (LKPs) in a cohort of zebrafish embryos (A and B) Comparison of the LKPs’ mean (line) and variance (shaded area), calculated for selected cell populations (selection at the tail bud stage, Figure S8, Video S22), hypoblast (red) and epiblast (blue) in embryos wt1-wt5 (rows 1 through 5, respectively). (A) Instantaneous LKPs. Time in hpf. The vertical dashed black line indicates the onset of epiblast compression chosen as the initial time ( ). (B) LKPs cumulated from ( ) for the next 6 h, mean (line) and variance (shaded area). The five plots are aligned in time using as reference. Hypoblast was not analyzed in embryo wt2 as it was not detected at because of that embryo’s position in the field of view. |
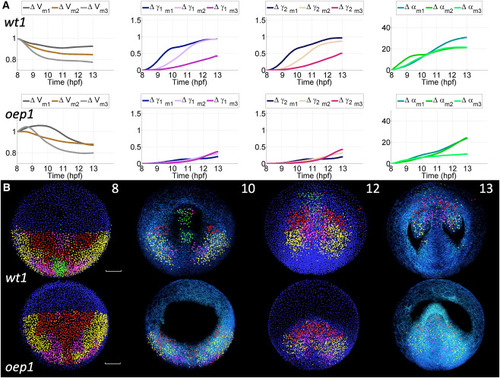
Unsupervised clustering and reduced-order models of cumulative deformation in normal and oep mutant embryos: Canonical Lagrangian Kinematic Profiles and Biomechanical Maps (A) Mean (subindex m) time course of cumulative deformation metrics (e.g., ) for each of the three clusters (number of clusters identified as optimal, see Figures S10 and S12) define the canonical Lagrangian kinematic profiles (CLKPs) in the wild type embryo (top row) and the mutant (bottom row). Lines are color-coded to differentiate the three CLKPs. For , values higher and lower than 1 indicate expansion and compression, respectively. For and , the values range from no distortion (0) to maximum distortion (3). For , the value represents rotation angles in degrees. (B) Reduced-order biomechanical maps obtained for wt1 and oep1 embryos. Cells at = 8 hpf were selected in Mov-IT and clustered according to their Lagrangian biomechanical signature (9-component vector expressing the similarity of each trajectory’s Lagrangian deformation metrics to the CLKPs, see Figure S13). Four and three distinct domains (clusters) were obtained for the wt1 and ope1 embryos, respectively, and color-labeled at = 8 hpf. This color code was propagated along the cell lineages belonging to each domain (time point indicated at the top right corner of the top row panels, expressed in hpf). At 8 and 12 hpf, unlabeled nuclei in blue. At 10 and 13 hpf, the labeled nuclear centers are displayed together with the membrane raw data (3D rendering in blue). The upper sections were removed down to 65 below the embryo surface to facilitate visualization. Scale bar 50 . First row: wt1 embryo (Videos S23, S24, and S25). Second row: oep1 embryo (Video S26). |
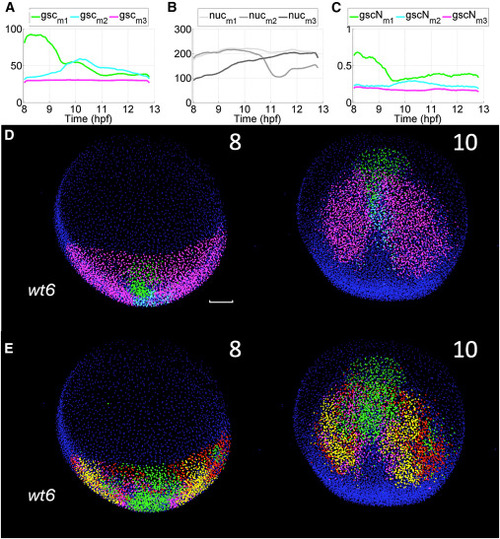
Reduced-order models of tissue deformation and gsc reporter expression yield corresponding maps (A – E) wt6 embryo from the transgenic line Tg(gsc:EGFP) (STAR Methods) imaged from 8 to 13 hpf (A) Quantification of gsc reporter expression at the single cell level (STAR Methods, Table S1) and k-means clustering of cell populations according to the reporter expression level (k = 3 green - -, light blue -- and magenta - - for the mean expression level in each cluster). (B) Average time course of nuclear staining intensity along cell trajectories for each cluster: , and . (C) Average value of the gsc reporter expression along each cluster’s cell trajectories, normalized by nuclear staining intensity ( , and ). (D) Reduced-order maps of gsc reporter expression showing three domains and their spatiotemporal organization (green - -, light blue -- and magenta - , time points 8 and 10 hpf indicated top right of each panel). Cells at 8 hpf are color-labeled according to the cluster they belong to and the color is propagated along the cell lineage. (E) Reduced-order biomechanical map showing four domains and their spatiotemporal organization similar to wt1 in Figure 5 (time points 8 and 10 hpf indicated top right of each panel, = 8 hpf). Scale bar 50 . |