
Fig. 6
- ID
- ZDB-FIG-250429-53
- Publication
- Pastor-Escuredo et al., 2025 - Unsupervised spatiotemporal classification of deformation patterns of embryonic tissues matches their fate map
- Other Figures
- All Figure Page
- Back to All Figure Page
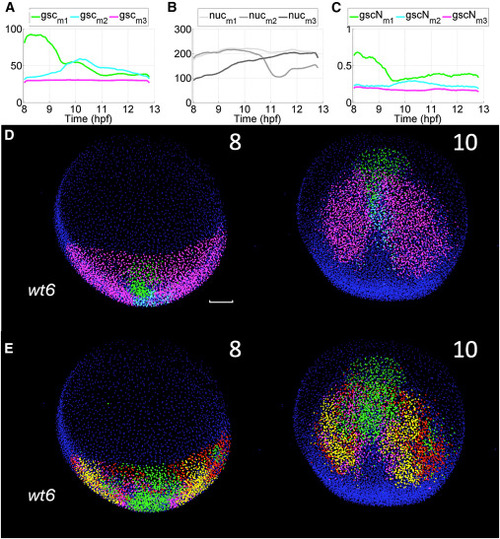
Reduced-order models of tissue deformation and gsc reporter expression yield corresponding maps (A – E) wt6 embryo from the transgenic line Tg(gsc:EGFP) (STAR Methods) imaged from 8 to 13 hpf (A) Quantification of gsc reporter expression at the single cell level (STAR Methods, Table S1) and k-means clustering of cell populations according to the reporter expression level (k = 3 green - -, light blue -- and magenta - - for the mean expression level in each cluster). (B) Average time course of nuclear staining intensity along cell trajectories for each cluster: , and . (C) Average value of the gsc reporter expression along each cluster’s cell trajectories, normalized by nuclear staining intensity ( , and ). (D) Reduced-order maps of gsc reporter expression showing three domains and their spatiotemporal organization (green - -, light blue -- and magenta - , time points 8 and 10 hpf indicated top right of each panel). Cells at 8 hpf are color-labeled according to the cluster they belong to and the color is propagated along the cell lineage. (E) Reduced-order biomechanical map showing four domains and their spatiotemporal organization similar to wt1 in Figure 5 (time points 8 and 10 hpf indicated top right of each panel, = 8 hpf). Scale bar 50 . |