
|
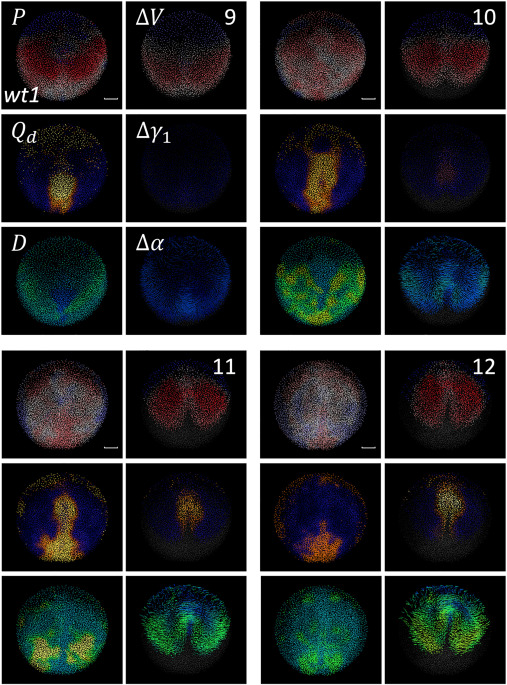
Fig. 3 Cumulative descriptors of wt development Comparison between Eulerian and Lagrangian descriptors for wild-type embryo wt1 at four time points during gastrulation (9, 10, 11 and 12 hpf, as shown at the top right corner of each panel group). The deformation descriptors shown are P, , and from left to right and from top to bottom, as indicated in the top left panel group. Lagrangian (, and ) and Eulerian (, , ) descriptors are juxtaposed in the left and right columns of each panel group, respectively. Lagrangian descriptors use the following color schemes: colormap from compression (red) to neutral (gray) to expansion (blue); colormap from dark (no distortion) to bright (maximum distortion); colormap from blue (no rotation) to green-yellow (maximum rotation). Eulerian descriptors use the following color schemes: colormap from compression (red) to neutral (gray) to expansion (blue); from dark (no distortion) to bright (maximum distortion); colormap goes from blue (no rotation) to green-yellow (maximum rotation). Scale bar 50 .