
|
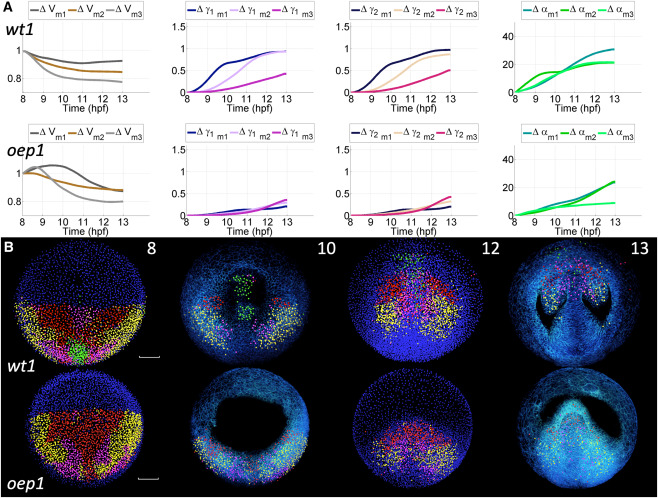
Fig. 5 Unsupervised clustering and reduced-order models of cumulative deformation in normal and oep mutant embryos: Canonical Lagrangian Kinematic Profiles and Biomechanical Maps (A) Mean (subindex m) time course of cumulative deformation metrics (e.g., ) for each of the three clusters (number of clusters identified as optimal, see Figures S10 and S12) define the canonical Lagrangian kinematic profiles (CLKPs) in the wild type embryo (top row) and the mutant (bottom row). Lines are color-coded to differentiate the three CLKPs. For , values higher and lower than 1 indicate expansion and compression, respectively. For and , the values range from no distortion (0) to maximum distortion (3). For , the value represents rotation angles in degrees. (B) Reduced-order biomechanical maps obtained for wt1 and oep1 embryos. Cells at = 8 hpf were selected in Mov-IT and clustered according to their Lagrangian biomechanical signature (9-component vector expressing the similarity of each trajectory’s Lagrangian deformation metrics to the CLKPs, see Figure S13). Four and three distinct domains (clusters) were obtained for the wt1 and ope1 embryos, respectively, and color-labeled at = 8 hpf. This color code was propagated along the cell lineages belonging to each domain (time point indicated at the top right corner of the top row panels, expressed in hpf). At 8 and 12 hpf, unlabeled nuclei in blue. At 10 and 13 hpf, the labeled nuclear centers are displayed together with the membrane raw data (3D rendering in blue). The upper sections were removed down to 65 below the embryo surface to facilitate visualization. Scale bar 50 . First row: wt1 embryo (Videos S23, S24, and S25). Second row: oep1 embryo (Video S26).