
|
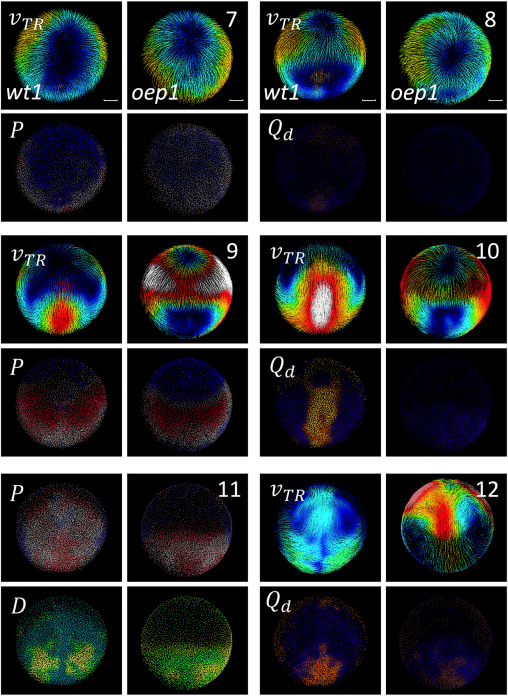
Fig. 2 Biomechanical landmarks of gastrulationin wt and zoeptz57/tz57 Comparison between a wild-type embryo wt1 (columns 1 and 3) and a zoeptz57/tz57 mutant embryo oep1 (columns 2 and 4). Time point (7, 8, 9, 10, 11 and 12 hpf) indicated to right. Descriptor indicated top left of each pair (wt1 and oep1) of panels. Velocity field ( ) colormap from dark (zero) to white (2 ). colormap goes from compression (red) to neutral (gray) to expansion (blue). colormap from dark (no distortion) to bright (maximum distortion). Rotation discriminant colormap from blue (no rotation) to green-yellow (maximum rotation observed). Scale bar 50 .