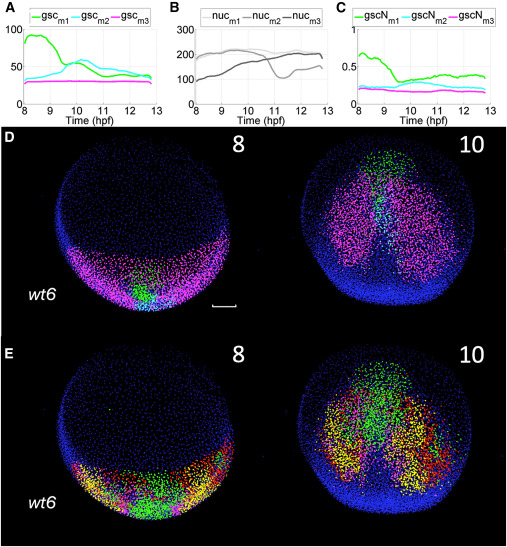
Fig. 6 Reduced-order models of tissue deformation and gsc reporter expression yield corresponding maps (A – E) wt6 embryo from the transgenic line Tg(gsc:EGFP) (STAR Methods) imaged from 8 to 13 hpf (A) Quantification of gsc reporter expression at the single cell level (STAR Methods, Table S1) and k-means clustering of cell populations according to the reporter expression level (k = 3 green - -, light blue -- and magenta - - for the mean expression level in each cluster). (B) Average time course of nuclear staining intensity along cell trajectories for each cluster: , and . (C) Average value of the gsc reporter expression along each cluster’s cell trajectories, normalized by nuclear staining intensity ( , and ). (D) Reduced-order maps of gsc reporter expression showing three domains and their spatiotemporal organization (green - -, light blue -- and magenta - , time points 8 and 10 hpf indicated top right of each panel). Cells at 8 hpf are color-labeled according to the cluster they belong to and the color is propagated along the cell lineage. (E) Reduced-order biomechanical map showing four domains and their spatiotemporal organization similar to wt1 in Figure 5 (time points 8 and 10 hpf indicated top right of each panel, = 8 hpf). Scale bar 50 .
Image
Figure Caption
Acknowledgments
This image is the copyrighted work of the attributed author or publisher, and
ZFIN has permission only to display this image to its users.
Additional permissions should be obtained from the applicable author or publisher of the image.
Full text @ iScience

