
- Title
-
A tunable and versatile chemogenetic near-infrared fluorescent reporter
- Authors
- El Hajji, L., Bunel, B., Joliot, O., Li, C., Tebo, A.G., Rampon, C., Volovitch, M., Fischer, E., Pietrancosta, N., Perez, F., Morin, X., Vriz, S., Gautier, A.
- Source
- Full text @ Nat. Commun.
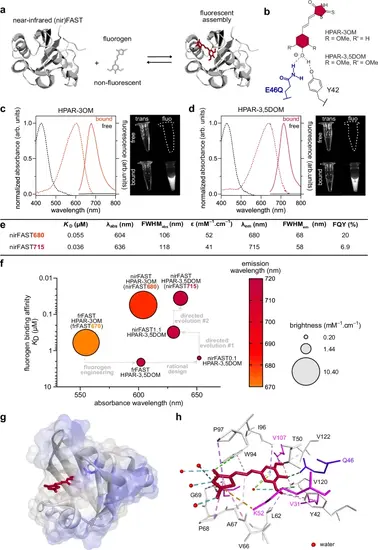
nirFAST, a versatile and tunable near-infrared fluorescent chemogenetic reporter.a Principle of nirFAST. b Structure of the anionic state of HPAR-3OM and HPAR-3,5DOM in interaction with residues Y42 and Q46. c Absorption (dashed line, left axis) and emission (solid line, right axis) spectra of HPAR-3OM free (black) or bound (orange) to nirFAST. Spectra were recorded in pH 7.4 PBS at 25 °C. The image on the right shows the fluorescence of solutions of HPAR-3OM free or bound to nirFAST under illumination with far-red light. d Absorption (dashed line) and emission (solid line) spectra of HPAR-3,5DOM free (black) or bound (dark red) to nirFAST. Spectra were recorded in pH 7.4 PBS at 25 °C. The image on the right shows the fluorescence of solutions of HPAR-3,5DOM free or bound to nirFAST under illumination with far-red light. e Properties of nirFAST with HPAR-3OM (nirFAST680) and with HPAR-3,5DOM (nirFAST715) in PBS pH 7.4. KD thermodynamic dissociation constant, λabs wavelength of maximal absorption, FWHMabs full width at half-maximal absorption, ε molar absorptivity at λabs, λem wavelength of maximal emission, FWHMem full width at half-maximal emission, FQY fluorescence quantum yield. f Engineering of nirFAST from frFAST670: the thermodynamic dissociation constant KD, absorption wavelength, emission wavelength, and brightness of the main engineering intermediates are indicated. g, h Structural model of nirFAST715 generated by homology modeling and molecular dynamics using the crystal structure of the Halorhodospira halophila Photoactive Yellow Protein (PYP) (PDB: 6P4I). HPAR-3,5DOM is in red, while Gln46 is in blue. h Interactions networks involved in HPAR-3,5DOM binding and recognition within nirFAST. Residues introduced during the engineering process are shown in magenta. See also Supplementary Fig. 6 and Supplementary Data for additional details. Source data are provided as a Source Data file. |
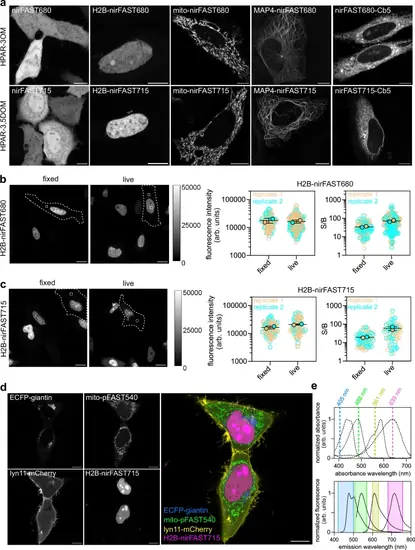
Selective imaging of nirFAST in various localizations in mammalian cells.a Live HeLa cells expressing nirFAST-P2A-EGFP or nirFAST fused to: histone H2B, mito (mitochondrial targeting motif), microtubule-associated protein (MAP) 4 and cytochrome b5 (Cb5) for endoplasmic reticulum membrane targeting, and labeled with 10 μM of HPAR-3OM (top row) (to assemble nirFAST680) or HPAR-3,5DOM (bottom row) (to assemble nirFAST715). Scale bars, 10 μm. Representative confocal micrographs from three independent experiments (n > 13 cells). b, c Labeling of H2B-nirFAST in live and fixed cells. Nuclear fluorescence intensity and comparison of signal (nucleus) to background (cytosol) ratio (S/B) in live and fixed cells incubated with 10 µM of HPAR-3OM (to assemble nirFAST680) (b) or HPAR-3,5DOM (to assemble nirFAST715) (c), and imaged with identical microscope settings. On the graphs, each cell is color-coded according to the biological replicate it came from. The solid circles correspond to the mean of each biological replicate. The black line represents the mean ± SD of the two biological replicates. For nuclear fluorescence evaluation, 103 (respectively 93) fixed cells and 220 (respectively 83) live cells from two independent experiments were used for HPAR-3OM (respectively HPAR−3,5DOM). For S/B evaluation, 103 (respectively 79) fixed cells and 189 (respectively 76) live cells from two experiments were used for HPAR-3OM (respectively HPAR−3,5DOM) analysis. Scale bars, 20 µm. d Live HeLa cells co-expressing ECFP fused to giantin, pFAST fused to mitochondria targeting sequence (mito), mCherry fused to lyn11 (inner membrane-targeting motif) and nirFAST fused to H2B. Cells were labeled with 1 µM HMBR to assemble pFAST540 and 10 µM HPAR-3,5DOM to assemble nirFAST715. Representative confocal micrographs from two independent experiments (n = 22 cells). Scale bars, 10 µm. e Imaging settings and spectral properties of the reporters used in (d). Absorption (dashed lines) and emission spectra (solid lines) of ECFP, pFAST540, Cherry, and nirFAST715 are shown. The graph shows the excitation wavelengths and the spectral windows used for imaging. See Supplementary Table 8 for detailed imaging settings. Source data are provided as a Source Data file. |
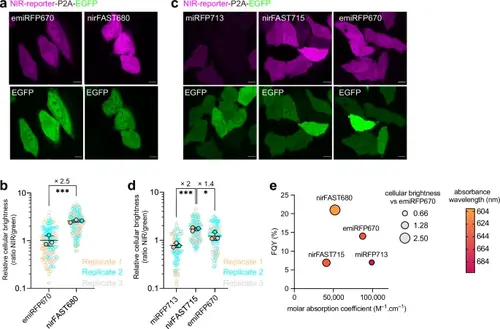
Comparison of nirFAST with emiRFP670 and miRFP713.a Hela cells expressing nirFAST-P2A-EGFP (labeled with 10 µM HPAR-3OM to assemble nirFAST680) and emiRFP670-P2A-EGFP. Scale bars, 10 µm. Representative confocal micrographs of n > 100 cells from three independent experiments. b Relative cellular brightness of nirFAST680 and emiRFP670 computed by normalizing the fluorescence of the NIR reporters with the fluorescence of the stoichiometrically expressed EGFP (ratio NIR/green). Each cell is color-coded according to the biological replicate it came from. The solid circles correspond to the mean of each biological replicate. The black line represents the mean ± SD of the three biological replicates. n = 115 (respectively n = 108) live cells from three independent experiments were used for nirFAST680 (respectively emiRFP670). An unpaired two-tailed t-test assuming equal variance was used to compare the two distributions (***P = 0.0008). c Hela cells expressing miRFP713-P2A-EGFP, nirFAST-P2A-EGFP (labeled with 10 µM HPAR−3,5DOM to assemble nirFAST715) and emiRFP670-P2A-EGFP. Scale bars, 10 µm. Representative confocal micrographs of n > 70 cells from three independent experiments. d Relative cellular brightness of miRFP713, nirFAST715, and emiRFP670 computed by normalizing the fluorescence of the NIR reporters with the fluorescence of the stoichiometrically expressed EGFP (ratio NIR/green). Each cell is color-coded according to the biological replicate it came from. The solid circles correspond to the mean of each biological replicate. The black line represents the mean ± SD of the three biological replicates. n = 106 (respectively n = 78 and n = 74) live cells from three independent experiments were used for nirFAST715 (respectively miRFP713 and emiRFP670). An unpaired two-tailed t-test assuming equal variance was used to compare miRFP713 and nirFAST715 distributions (***P = 0.0006, *P = 0.0340). a–d For all these experiments, identical microscope settings were used for enabling side-by-side comparison. e Photophysical properties of emiRFP6706, nirFAST680, miRFP7136, and nirFAST715. FQY of these reporters are plotted against their molar absorption coefficient. Each data point size is scaled to the cellular fluorescence brightness of the corresponding fluorescent reporter, and the color is indicative of the absorption wavelength. See Supplementary Table 8 for detailed imaging settings. Source data are provided as a Source Data file. |
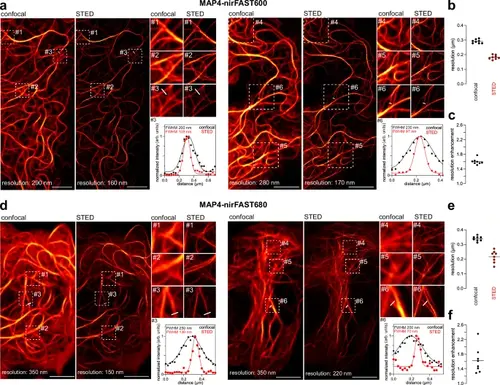
STED imaging of nirFAST-tagged proteins in live mammalian cells.Confocal and STED micrographs of two live HeLa cells expressing nirFAST fused to MAP4 and labeled with 10 µM of HBR−3,5DOM (to assemble nirFAST600) (a–c) or 10 µM of HPAR-3OM to assemble (nirFAST680) (d–f). For each cell, three regions of interest were selected for close-up comparison between confocal and STED. Line profile across microtubule filaments from one close-up was used to compare the gain in resolution between confocal and STED. Graph shows raw data of line profile from confocal and STED images (points), in addition to the corresponding Gaussian fit (line). Micrographs are representative of n = 8 cells from two independent experiments for HBR-3,5DOM (a) and HPAR-3OM (d). Scale bars, 5 µm. b Comparison of resolution of confocal and STED MAP4-nirFAST680 micrographs using image decorrelation analysis19 (n = 8 cells). c Enhancement of resolution of MAP4-nirFAST600 micrographs, calculated as the ratio between confocal resolution and STED resolution from (b). e Comparison of resolution of confocal and STED MAP4-nirFAST680 micrographs using image decorrelation analysis19 (n = 8 cells). f Enhancement of resolution of MAP4-nirFAST680 micrographs, calculated as the ratio between confocal resolution and STED resolution from (e). See Supplementary Table 8 for detailed imaging settings and methods section for image decorrelation analysis parameters. Source data are provided as a Source Data file. |
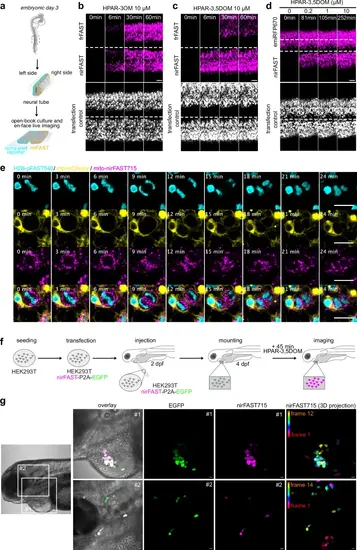
Selective imaging of nirFAST in chicken embryo and zebrafish larvae.a–c Plasmids encoding nirFAST-P2A-EGFP and frFAST-P2A-EGFP were electroporated in each side of the neural tube in ovo at embryonic day 2. 24 h later, embryos with homogenous bilateral reporter expression in the neural tube were dissected and imaged upon the addition of 10 µM of HPAR-3OM or HPAR-3,5DOM by timelapse spinning disk microscopy. Scale bars 100 µm. Representative timelapse micrographs of n = 3 independent experiments. d Plasmids encoding nirFAST-P2A-EGFP and emiRFP670-P2A-EGFP were electroporated in each side of the neural tube in ovo at embryonic day 2. Twenty-four hours later, embryos with homogenous bilateral reporter expression in the neural tube were dissected and the neuroepithelium was imaged in en-face view by timelapse spinning disk microscopy upon sequential addition of 0.2, 1, and 10 μM HPAR-3,5DOM. Scale bars 100 µm. Representative micrographs of n = 3 independent experiments. e Plasmids encoding H2B-pFAST (cyan), memb-mCherry (yellow) and mito-nirFAST (magenta) were electroporated in the neural tube in ovo, at embryonic day 2 (E2, HH stage 13–14). Twenty-four hours later, embryos were dissected, and the neuroepithelium was imaged in en-face view in the presence of 1 μM HMBR (to assemble pFAST540) and 10 μM HPAR−3,5DOM (to assemble nirFAST715) using a spinning disk microscope (see also Supplementary Movie 2). Scale bars, 10 µm. Representative micrographs of n = 3 independent experiments. f, g Mammalian HEK293T were transfected with plasmid encoding nirFAST-P2A-EGFP. After 24 h, they were injected near the heart of 2 dpf zebrafish larvae. Larvae with green fluorescence signal were selected and imaged at 4 dpf after 45 min incubation with HPAR-3,5DOM (to assemble nirFAST715). Representative micrographs of n = 3 independent experiments. Scale bars, 20 µm. See Supplementary Table 8 for detailed imaging settings. |
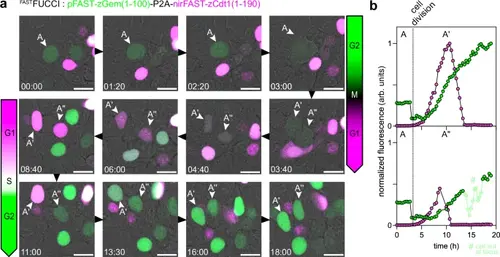
FASTFUCCI, a green-NIR fluorescent chemogenetic cell-cycle indicator.a HEK293T cells expressing FASTFUCCI and treated with 1 µM HMBR (to assemble pFAST540) and 10 µM HPAR-3,5DOM (to assemble nirFAST715) were imaged by timelapse confocal microscopy (1 frame every 20 min) for 24 h. Relevant timepoints of the designated field of view are shown to highlight transitions between the different cell cycle stages. Representative micrographs from three independent experiments (see also Supplementary Movie 4). b Fluorescence intensity evolution of tracked cell (cell A), which upon mitosis gives cells A’ and cells A”, is shown over time. Cell tracking and lineage was achieved through the Trackmate plugin (Fiji)41,42. See Supplementary Table 8 for detailed imaging settings. Source data are provided as a Source Data file. |
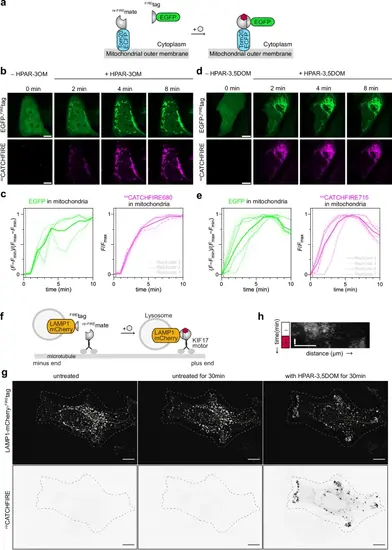
nirCATCHFIRE: a fluorogenic chemically induced dimerization tool with NIR fluorescence readout.a Schematic illustrating the fluorogen-induced interaction between EGFP-FIREtag and Tom20-ECFP-nir-FIREmate for chemically induced recruitment at the outer mitochondrial membrane. b–e HeLa cells co-expressing EGFP-FIREtag together with Tom20-ECFP-nir-FIREmate were treated with 10 µM of either HPAR-3OM (b, c) or HPAR−3,5DOM (d, e), and imaged by timelapse confocal microscopy. b, d Representative confocal micrographs before and after the addition of the fluorogen (see also Supplementary Movies 5, 6). Scale bar 10 µm. c, e Temporal evolution of the mitochondrial EGFP and nirCATCHFIRE fluorescence of (c) n = 15 cells (from three independent experiments) and (d) n = 14 cells (from four independent experiments). The dashed line indicates fluorogen addition. f Schematic illustrating how fluorogen-induced interaction between LAMP1–mCherry–FIREtag and nir-FIREmate–KIF17 allows the chemically induced anterograde transport of lysosomes. g HeLa cells co-expressing LAMP1–mCherry–FIREtag and nir-FIREmate–KIF17 were imaged by spinning disk microscopy for 30 min, then HPAR−3,5DOM was added. Representative micrographs of each step (see also Supplementary Movie 7). Experiments were repeated three times with similar results. Scale bars 10 µm. h Kymograph showing the LAMP1–mCherry–FIREtag along the yellow line in (e) over time. See Supplementary Table 8 for detailed imaging settings. Source data are provided as a Source Data file. |