
Fig. 5
- ID
- ZDB-FIG-250417-45
- Publication
- El Hajji et al., 2025 - A tunable and versatile chemogenetic near-infrared fluorescent reporter
- Other Figures
- All Figure Page
- Back to All Figure Page
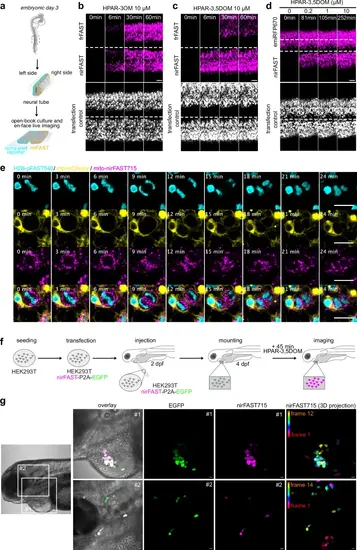
Selective imaging of nirFAST in chicken embryo and zebrafish larvae.a–c Plasmids encoding nirFAST-P2A-EGFP and frFAST-P2A-EGFP were electroporated in each side of the neural tube in ovo at embryonic day 2. 24 h later, embryos with homogenous bilateral reporter expression in the neural tube were dissected and imaged upon the addition of 10 µM of HPAR-3OM or HPAR-3,5DOM by timelapse spinning disk microscopy. Scale bars 100 µm. Representative timelapse micrographs of n = 3 independent experiments. d Plasmids encoding nirFAST-P2A-EGFP and emiRFP670-P2A-EGFP were electroporated in each side of the neural tube in ovo at embryonic day 2. Twenty-four hours later, embryos with homogenous bilateral reporter expression in the neural tube were dissected and the neuroepithelium was imaged in en-face view by timelapse spinning disk microscopy upon sequential addition of 0.2, 1, and 10 μM HPAR-3,5DOM. Scale bars 100 µm. Representative micrographs of n = 3 independent experiments. e Plasmids encoding H2B-pFAST (cyan), memb-mCherry (yellow) and mito-nirFAST (magenta) were electroporated in the neural tube in ovo, at embryonic day 2 (E2, HH stage 13–14). Twenty-four hours later, embryos were dissected, and the neuroepithelium was imaged in en-face view in the presence of 1 μM HMBR (to assemble pFAST540) and 10 μM HPAR−3,5DOM (to assemble nirFAST715) using a spinning disk microscope (see also Supplementary Movie 2). Scale bars, 10 µm. Representative micrographs of n = 3 independent experiments. f, g Mammalian HEK293T were transfected with plasmid encoding nirFAST-P2A-EGFP. After 24 h, they were injected near the heart of 2 dpf zebrafish larvae. Larvae with green fluorescence signal were selected and imaged at 4 dpf after 45 min incubation with HPAR-3,5DOM (to assemble nirFAST715). Representative micrographs of n = 3 independent experiments. Scale bars, 20 µm. See Supplementary Table 8 for detailed imaging settings. |