
Fig. 2
- ID
- ZDB-FIG-250417-42
- Publication
- El Hajji et al., 2025 - A tunable and versatile chemogenetic near-infrared fluorescent reporter
- Other Figures
- All Figure Page
- Back to All Figure Page
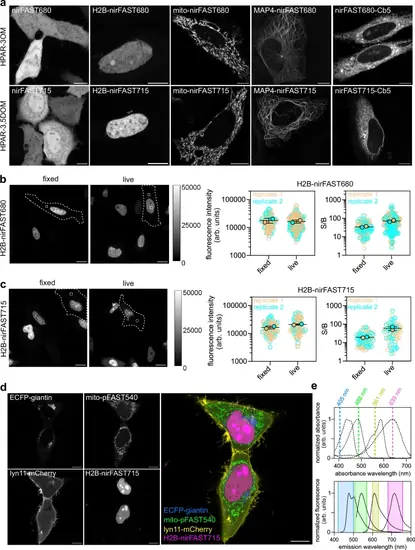
Selective imaging of nirFAST in various localizations in mammalian cells.a Live HeLa cells expressing nirFAST-P2A-EGFP or nirFAST fused to: histone H2B, mito (mitochondrial targeting motif), microtubule-associated protein (MAP) 4 and cytochrome b5 (Cb5) for endoplasmic reticulum membrane targeting, and labeled with 10 μM of HPAR-3OM (top row) (to assemble nirFAST680) or HPAR-3,5DOM (bottom row) (to assemble nirFAST715). Scale bars, 10 μm. Representative confocal micrographs from three independent experiments (n > 13 cells). b, c Labeling of H2B-nirFAST in live and fixed cells. Nuclear fluorescence intensity and comparison of signal (nucleus) to background (cytosol) ratio (S/B) in live and fixed cells incubated with 10 µM of HPAR-3OM (to assemble nirFAST680) (b) or HPAR-3,5DOM (to assemble nirFAST715) (c), and imaged with identical microscope settings. On the graphs, each cell is color-coded according to the biological replicate it came from. The solid circles correspond to the mean of each biological replicate. The black line represents the mean ± SD of the two biological replicates. For nuclear fluorescence evaluation, 103 (respectively 93) fixed cells and 220 (respectively 83) live cells from two independent experiments were used for HPAR-3OM (respectively HPAR−3,5DOM). For S/B evaluation, 103 (respectively 79) fixed cells and 189 (respectively 76) live cells from two experiments were used for HPAR-3OM (respectively HPAR−3,5DOM) analysis. Scale bars, 20 µm. d Live HeLa cells co-expressing ECFP fused to giantin, pFAST fused to mitochondria targeting sequence (mito), mCherry fused to lyn11 (inner membrane-targeting motif) and nirFAST fused to H2B. Cells were labeled with 1 µM HMBR to assemble pFAST540 and 10 µM HPAR-3,5DOM to assemble nirFAST715. Representative confocal micrographs from two independent experiments (n = 22 cells). Scale bars, 10 µm. e Imaging settings and spectral properties of the reporters used in (d). Absorption (dashed lines) and emission spectra (solid lines) of ECFP, pFAST540, Cherry, and nirFAST715 are shown. The graph shows the excitation wavelengths and the spectral windows used for imaging. See Supplementary Table 8 for detailed imaging settings. Source data are provided as a Source Data file. |