
|
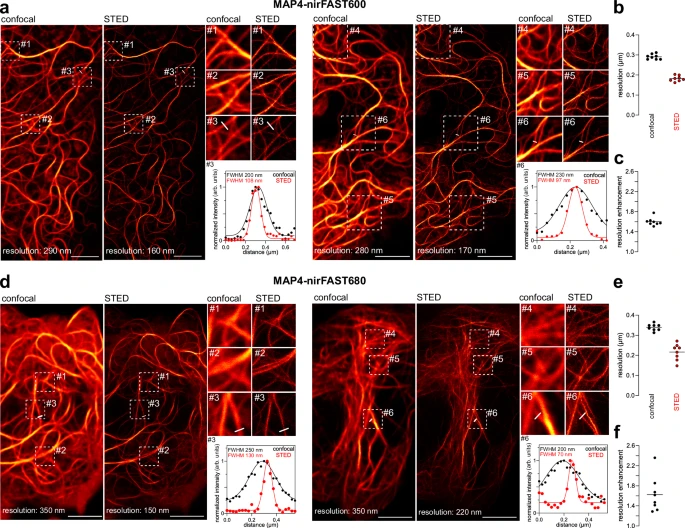
Fig. 4 STED imaging of nirFAST-tagged proteins in live mammalian cells.Confocal and STED micrographs of two live HeLa cells expressing nirFAST fused to MAP4 and labeled with 10 µM of HBR−3,5DOM (to assemble nirFAST600) (a–c) or 10 µM of HPAR-3OM to assemble (nirFAST680) (d–f). For each cell, three regions of interest were selected for close-up comparison between confocal and STED. Line profile across microtubule filaments from one close-up was used to compare the gain in resolution between confocal and STED. Graph shows raw data of line profile from confocal and STED images (points), in addition to the corresponding Gaussian fit (line). Micrographs are representative of n = 8 cells from two independent experiments for HBR-3,5DOM (a) and HPAR-3OM (d). Scale bars, 5 µm. b Comparison of resolution of confocal and STED MAP4-nirFAST680 micrographs using image decorrelation analysis19 (n = 8 cells). c Enhancement of resolution of MAP4-nirFAST600 micrographs, calculated as the ratio between confocal resolution and STED resolution from (b). e Comparison of resolution of confocal and STED MAP4-nirFAST680 micrographs using image decorrelation analysis19 (n = 8 cells). f Enhancement of resolution of MAP4-nirFAST680 micrographs, calculated as the ratio between confocal resolution and STED resolution from (e). See Supplementary Table 8 for detailed imaging settings and methods section for image decorrelation analysis parameters. Source data are provided as a Source Data file.