
Fig. 3
- ID
- ZDB-FIG-250417-43
- Publication
- El Hajji et al., 2025 - A tunable and versatile chemogenetic near-infrared fluorescent reporter
- Other Figures
- All Figure Page
- Back to All Figure Page
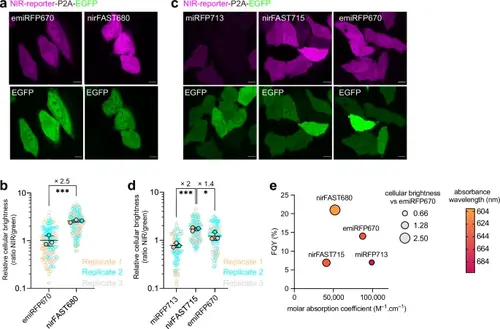
Comparison of nirFAST with emiRFP670 and miRFP713.a Hela cells expressing nirFAST-P2A-EGFP (labeled with 10 µM HPAR-3OM to assemble nirFAST680) and emiRFP670-P2A-EGFP. Scale bars, 10 µm. Representative confocal micrographs of n > 100 cells from three independent experiments. b Relative cellular brightness of nirFAST680 and emiRFP670 computed by normalizing the fluorescence of the NIR reporters with the fluorescence of the stoichiometrically expressed EGFP (ratio NIR/green). Each cell is color-coded according to the biological replicate it came from. The solid circles correspond to the mean of each biological replicate. The black line represents the mean ± SD of the three biological replicates. n = 115 (respectively n = 108) live cells from three independent experiments were used for nirFAST680 (respectively emiRFP670). An unpaired two-tailed t-test assuming equal variance was used to compare the two distributions (***P = 0.0008). c Hela cells expressing miRFP713-P2A-EGFP, nirFAST-P2A-EGFP (labeled with 10 µM HPAR−3,5DOM to assemble nirFAST715) and emiRFP670-P2A-EGFP. Scale bars, 10 µm. Representative confocal micrographs of n > 70 cells from three independent experiments. d Relative cellular brightness of miRFP713, nirFAST715, and emiRFP670 computed by normalizing the fluorescence of the NIR reporters with the fluorescence of the stoichiometrically expressed EGFP (ratio NIR/green). Each cell is color-coded according to the biological replicate it came from. The solid circles correspond to the mean of each biological replicate. The black line represents the mean ± SD of the three biological replicates. n = 106 (respectively n = 78 and n = 74) live cells from three independent experiments were used for nirFAST715 (respectively miRFP713 and emiRFP670). An unpaired two-tailed t-test assuming equal variance was used to compare miRFP713 and nirFAST715 distributions (***P = 0.0006, *P = 0.0340). a–d For all these experiments, identical microscope settings were used for enabling side-by-side comparison. e Photophysical properties of emiRFP6706, nirFAST680, miRFP7136, and nirFAST715. FQY of these reporters are plotted against their molar absorption coefficient. Each data point size is scaled to the cellular fluorescence brightness of the corresponding fluorescent reporter, and the color is indicative of the absorption wavelength. See Supplementary Table 8 for detailed imaging settings. Source data are provided as a Source Data file. |