
- Title
-
An appetitive olfactory learning paradigm for zebrafish in their home tanks
- Authors
- Doyle, J.M., Fine, A., Croll, R.P.
- Source
- Full text @ Behav. Brain Res.
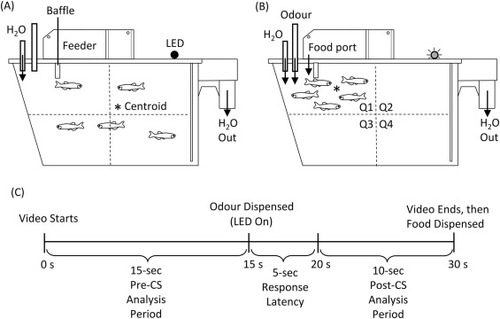
Diagram of behavioural apparatus for olfactory conditioning in home tanks. Panels A and B illustrate representative positions of experimental fish before and during the presentation of conditioned stimulus, respectively. In (A), the approximate mean position of the group of fish (centroid; *) is near the center of the tank. Water enters via a tube on the top left of the tank and exits on the right. In (B), the centroid is in Quadrant 1 (Q1), where the odour (phenylethyl alcohol; PEA) is dispensed via tube. A red LED indicated to the camera when the odourant is being delivered. Then, 15 seconds later, food is dispensed by the automatic feeder located above the tank. A plastic baffle keeps the food contained in Q1. In (C), a timeline of a single trial is presented. The video starts and 15 seconds of behaviour is recorded. Then, the odour is dispensed as indicated to the camera with the LED light. After 30 total seconds the video ends and then the experimental fish are fed, while control fish are fed at a later time in between trials. For the analysis, a latency period of 5 seconds was noted between the addition of the odour and the behavioural response of the fish. Therefore, only the last 10 seconds of the video was analysed. |
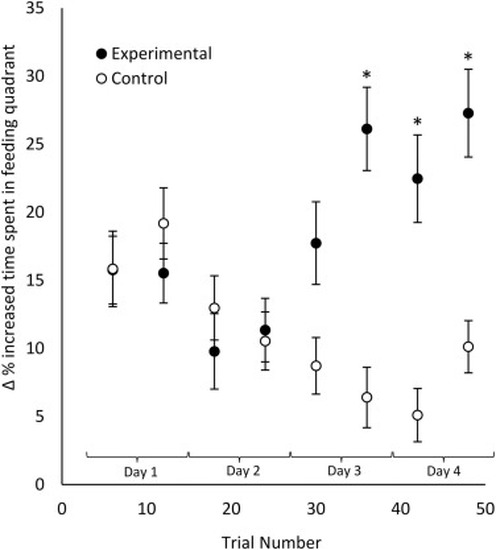
Change in percentage of time spent in Q1 (before PEA compared to during PEA exposure) over 48 trials (4 days). Zero indicates no change in percentage of time spent in Q1, near the feeding area. Zebrafish in experimental and control groups initially spent more time in Q1 following PEA delivery. This response decreased until the end of Day 2 with fish spending less time in Q1 as training progressed. However, starting on Day 3, the experimental group increased time spent in Q1, near the food source, while the control group continued to decrease. By the end of Day 4, there was a significant difference between the two groups. There was a significant interaction effect between treatment and trials. (F(1, 47) = 2.333, p = <0.001; Post-hoc pairwise comparisons were performed and significant findings were indicated with a ‘*’). Trials were binned in groups of six (comprising morning and evening sessions for each day). N = 23 tanks of 5 fish for each treatment. Error bars = ± S.E.M. |
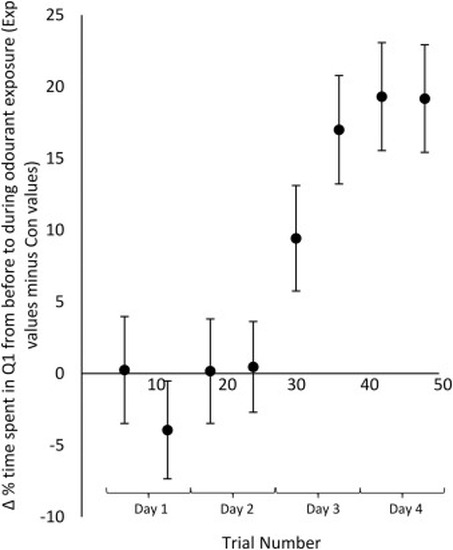
Change in percentage of time spent in Q1 (before PEA compared to during PEA exposure) over 48 trials (4 days) experimental group minus control group. Zero indicates no change in percentage of time spent in Q1, near the feeding area. The first two days, the difference between the groups was near zero, however over the next two days the difference increased greatly. Trials were binned in groups of six (morning and evening of training days). N = 23 tanks of 5 fish for each treatment. Error bars = ± S.E.M. |
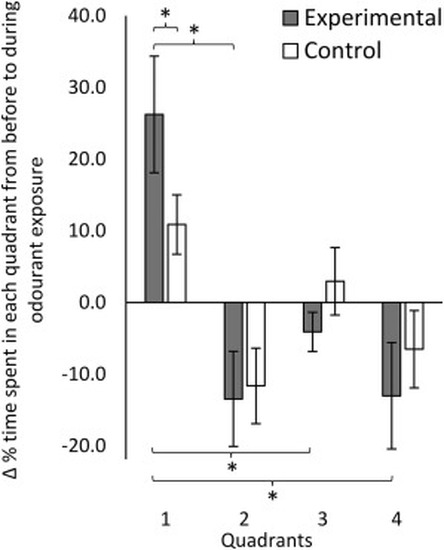
Change in percentage of time spent in each quadrant (before PEA compared to during PEA exposure) for the last six trials (binned) of training. Zero indicates no change in percentage of time spent in each quadrant. Both groups spent increased time in Q1 during PEA exposure, however the experimental group spent significantly more than the control group in Q1. There was a significant difference between quadrants in the experimental group but not the control group. (Two-way ANOVA (F(1,3) = 11.759, p = <0.001; Post-hoc pairwise comparisons were performed and significant findings were indicated with a ‘*’). Time spent in most other quadrants decreased, indicating that fish spent more time in Q1 after training at the expense of all other quadrants. N = 23 tanks of 5 fish for each treatment. Error bars = ± S.E.M. |
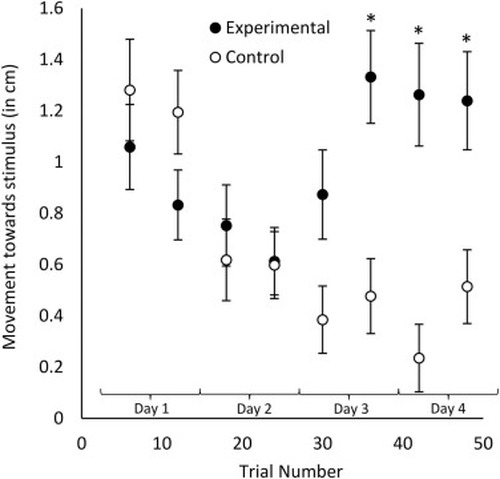
Movement of zebrafish groups during acquisition of an olfactory appetitive paradigm, regardless of quadrant boundaries. Zero indicates no movement from before to during PEA delivery. Initially, zebrafish in both experimental and control groups showed movement towards the site of later food delivery from their initial positions when exposed to the olfactory stimulus. This response decreased until the end of Day 2. Zebrafish in the control group showed less movement towards the feeding site in response to the olfactory stimulus as training progressed. However, the experimental group showed increased movement towards the food source. (Two-way RM ANOVA F(1, 47) = 1.584, p = 0.008; post-hoc pairwise p = 0.007; Post-hoc pairwise comparisons were performed and significant findings were indicated with a ‘*’). Trials were binned in groups of six (morning and evening of training days). Data points indicate mean distance from the food source before PEA delivery minus mean distance from the food source during PEA delivery. N = 23 tanks of 5 fish for each treatment. Error bars = ± S.E.M. |
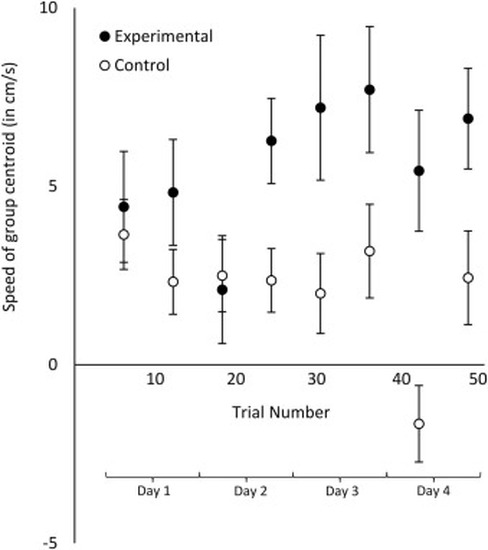
Total distance traversed of zebrafish group (as centroid) with respect to time (speed) during acquisition of an olfactory appetitive paradigm. The centroid of the zebrafish in both groups increased speed when exposed to olfactory stimulus. This response decreased throughout until the end of Day 2. Zebrafish in the control group showed less activity as training progressed. However, the experimental group showed increased activity. Analysis revealed any differences were not statistically significant (Two-way RM ANOVA F(1, 47) = 0.921, p = 0.626). Trials were binned in groups of six (morning and evening of training days). Data points represent total distance travelled (by centroid) before PEA delivery minus total distance travelled during PEA delivery. N = 23 tanks of 5 fish for each treatment. Error bars = ± S.E.M. |
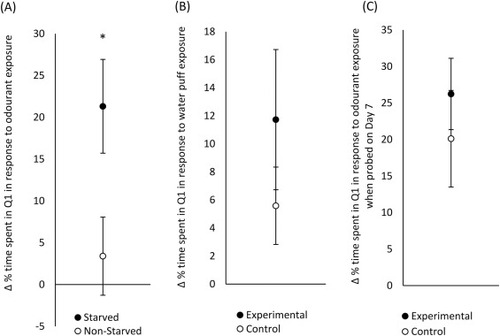
(A) Effect of food deprivation on novel PEA response. Change in percentage of time spent in Q1 from (before PEA compared to during PEA exposure) of starved (N = 37 tanks of 5 fish) vs non-starved zebrafish (N = 37 tanks of 5 fish) in response to novel PEA exposure. Starved (48 h) fish spent significantly more time in Q1 near the feeding area than non-starved fish (fed immediately before experiment; t-test, t(68) = 2.329, p = 0.011 (B) Response to water puff post-training. Change in percentage of time spent in Q1 (before water puff compared to during water puff) for experimental (N = 23 tanks of 5 fish) and control (N = 23 tanks of 5 fish) groups. The water puff trial showed no significant response by either the control or experimental fish (t-test, t(22) = -0.162, p = 0.467. (C) Memory retention seven days post-training. Change in percentage of time spent in Q1 from (before PEA compared to during PEA exposure) for retention trial at 7 days post training. There was no significant difference between time spent in Q1 between the experimental (N = 12 tanks of 5 fish). and control groups (N = 12 tanks of 5 fish; t-test, t(44) = 0.979, p = 0.166). For A, B & C: [Zero indicates no change in percentage of time spent in Q1, near the feeding area. Error bars = ± S.E.M.]. |