
|
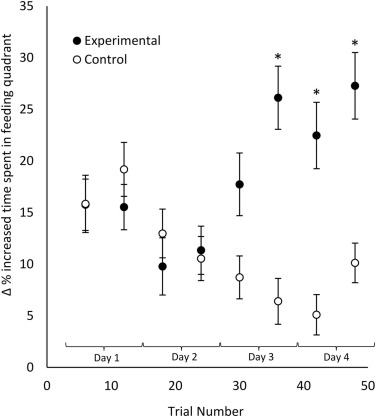
Fig. 2 Change in percentage of time spent in Q1 (before PEA compared to during PEA exposure) over 48 trials (4 days). Zero indicates no change in percentage of time spent in Q1, near the feeding area. Zebrafish in experimental and control groups initially spent more time in Q1 following PEA delivery. This response decreased until the end of Day 2 with fish spending less time in Q1 as training progressed. However, starting on Day 3, the experimental group increased time spent in Q1, near the food source, while the control group continued to decrease. By the end of Day 4, there was a significant difference between the two groups. There was a significant interaction effect between treatment and trials. (F(1, 47) = 2.333, p = <0.001; Post-hoc pairwise comparisons were performed and significant findings were indicated with a ‘*’). Trials were binned in groups of six (comprising morning and evening sessions for each day). N = 23 tanks of 5 fish for each treatment. Error bars = ± S.E.M.