
|
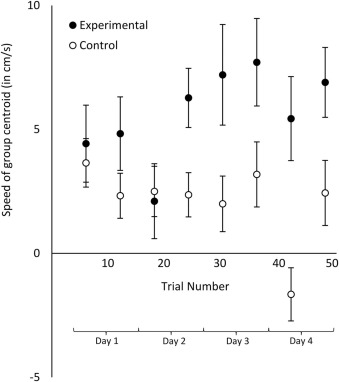
Fig. 6 Total distance traversed of zebrafish group (as centroid) with respect to time (speed) during acquisition of an olfactory appetitive paradigm. The centroid of the zebrafish in both groups increased speed when exposed to olfactory stimulus. This response decreased throughout until the end of Day 2. Zebrafish in the control group showed less activity as training progressed. However, the experimental group showed increased activity. Analysis revealed any differences were not statistically significant (Two-way RM ANOVA F(1, 47) = 0.921, p = 0.626). Trials were binned in groups of six (morning and evening of training days). Data points represent total distance travelled (by centroid) before PEA delivery minus total distance travelled during PEA delivery. N = 23 tanks of 5 fish for each treatment. Error bars = ± S.E.M.