
|
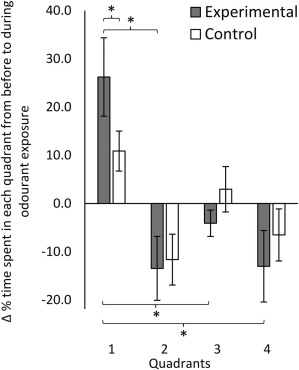
Fig. 4 Change in percentage of time spent in each quadrant (before PEA compared to during PEA exposure) for the last six trials (binned) of training. Zero indicates no change in percentage of time spent in each quadrant. Both groups spent increased time in Q1 during PEA exposure, however the experimental group spent significantly more than the control group in Q1. There was a significant difference between quadrants in the experimental group but not the control group. (Two-way ANOVA (F(1,3) = 11.759, p = <0.001; Post-hoc pairwise comparisons were performed and significant findings were indicated with a ‘*’). Time spent in most other quadrants decreased, indicating that fish spent more time in Q1 after training at the expense of all other quadrants. N = 23 tanks of 5 fish for each treatment. Error bars = ± S.E.M.