
Image
|
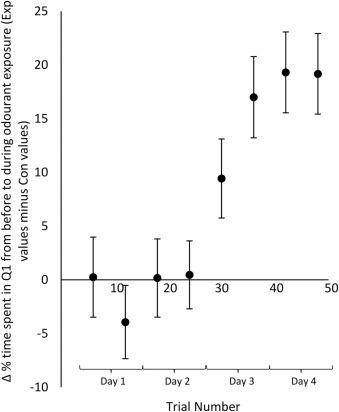
Figure Caption
Fig. 3 Change in percentage of time spent in Q1 (before PEA compared to during PEA exposure) over 48 trials (4 days) experimental group minus control group. Zero indicates no change in percentage of time spent in Q1, near the feeding area. The first two days, the difference between the groups was near zero, however over the next two days the difference increased greatly. Trials were binned in groups of six (morning and evening of training days). N = 23 tanks of 5 fish for each treatment. Error bars = ± S.E.M.
Acknowledgments
This image is the copyrighted work of the attributed author or publisher, and
ZFIN has permission only to display this image to its users.
Additional permissions should be obtained from the applicable author or publisher of the image.
Full text @ Behav. Brain Res.