
- Title
-
The synergistic effect of c-Myb hyperactivation and Pu.1 deficiency induces Pelger-Huët anomaly and promotes sAML
- Authors
- Xu, S., Hong, J., Dongye, M., Lin, J., Xue, R., Huang, Z., Xu, J., Zhang, Y., Leung, A.Y., Shen, J., Zhang, W., Liu, W.
- Source
- Full text @ Proc. Natl. Acad. Sci. USA
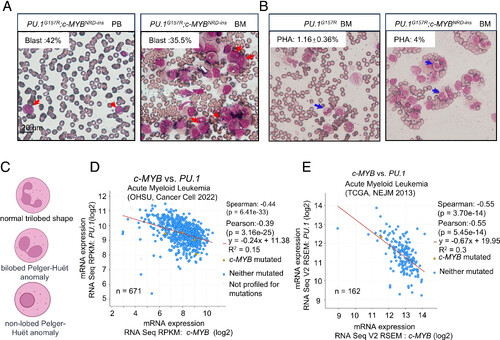
c-MYB and PU.1 mutated in a high-risk AML patient and reversed expressed in AML patients. (A) Blast cells in PB and bone marrow of AML patients(400×, red arrows indicate myeloid blasts). (B) Proportion of PHA cells in the bone marrow of AML patients with PU.1G15R or PU.1G157R; c-MYBNRD-ins variants after treatment (400×, blue arrows indicate PHA cells, mean ± SE). (C) Schematic of a normal trilobed neutrophil, bilobed PHA cell, and nonlobed PHA cell (graphical elements sourced from https://www.biorender.com/). (D and E) Correlation analysis of c-MYB and PU.1 expression in acute myeloid leukemia (AML) patients. The Spearman’s and Pearson’s correlation coefficients of c-MYB and PU.1 expression in 671 AML (Spearman’s: P = 6.41e-33, R = −0.44; Pearson’s: P = 3.16e-25, R = −0.39) (D) and 162 AML (Spearman’s: P = 3.70e-14, R = −0.55; Pearson’s: P = 5.45e-14, R = −0.55) (E) patients were measured. |

The number of immature neutrophils was significantly increased in c-mybhyper;pu.1G242D/G242D zebrafish embryos. (A and B) Accumulation of neutrophils in c-mybhyper;pu.1G242D/G242D embryos. WISH of cebpa, cebp1, and mpx expression at 5 dpf in wildtype, c-mybhyper, pu.1G242D/G242D, and c-mybhyper;pu.1G242D/G242D zebrafish. The caudal hematopoietic tissue (CHT) is enlarged in the red box (200×), n ≥ 6. (C) qPCR results of 5 dpf embryos from wildtype, c-mybhyper, pu.1G242D/G242D, and c-mybhyper;pu.1G242D/G242D (n >20, three biological replicate). (D–I) The neutrophil maturity and enzyme activity were decreased significantly in the c-mybhyper;pu.1G242D/G242D zebrafish. Granulocyte maturity was detected by SB staining (D), SB+ cell counts (F) and mean optical density (H) were calculated and compared at 5 dpf. The CHT is enlarged in the red box (200×). Green boxes show further enlarged regions focusing on a single cell (400×), n ≥ 13. Peroxidase activity was detected by DAB staining (E), DAB+ cell counts (G) and mean optical density (I) were calculated and compared at 5 dpf. Red boxes show a further enlarged region (400×), n ≥ 10. |
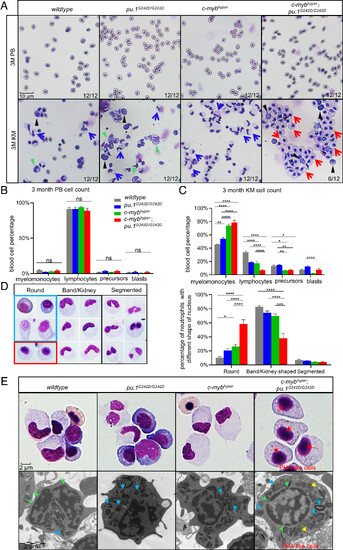
The myeloid cell count increased in 3-mo-old c-mybhyper;pu.1G242D/G242D zebrafishKM with neutrophils showing Pelger–Huët anomaly–like changes. (A–C) PB cells and KM blood cells (A) in 3-mo-old adult fish stained with May-Grunwald/Giemsa [400×, (black triangles indicate blasts, green triangles precursors, blue arrows indicate normal band/kidney-shaped neutrophils, and red arrows indicate abnormally rounded neutrophils)]. Blood cell counts of PB (B) and KM (C) were calculated manually based on their morphology. The black asterisks indicate statistical difference (n = 12). (D) Morphology and counting ratio of neutrophils with different nuclear morphologies (400×, the red box shows abnormal round nuclear cells in c-mybhyper;pu.1G242D/G242D zebrafish, the blue box shows normal immature round nuclear cells from the other three genotypes n = 6). (E) High-resolution imaging (upper, 600×) and TEM morphology (Lower) observation showed PHA-like cells in c-mybhyper;pu.1G242D/G242D zebrafish. Blue, yellow, red, and green arrows indicate crystal granules, vacuolar granules, chromatin clumping, and nuclear membranes, respectively. All TEM images are magnification ×12,000 and 80 kV. |

Pelger–Huët-like cells are a group of pathological neutrophils with poor differentiation. (A) Five subpopulations of neutrophils (GMP-Gs, GPs, Neutrophils-1, Neutrophils-2, and Neutrophils-3). (B) Temporal analysis of neutrophil in different subtypes (curve arrow indicating differentiation direction). (C) Detailed population diagram of neutrophils composition of wildtype, c-mybhyper, pu.1G242D/G242D, and c-mybhyper;pu.1G242D/G242D. Cells are colored by their cell-type annotation and numbered according to the legend beside. (The blue line indicated Neutrophils-2 population, the yellow line indicated Neutrophils-1 population, and the purple line indicated Neutrophils-3 population.) (D) Enriched GO pathways found in the analysis of DEGs in Neutrophils-3 vs. other neutrophil groups. Gene Ratio means Number of Differentially Expressed Genes/Total Number of Genes in the Pathway. Gene Number means the absolute number of target genes annotated to each pathway. (E) The expression of genes involved in differentiation. |
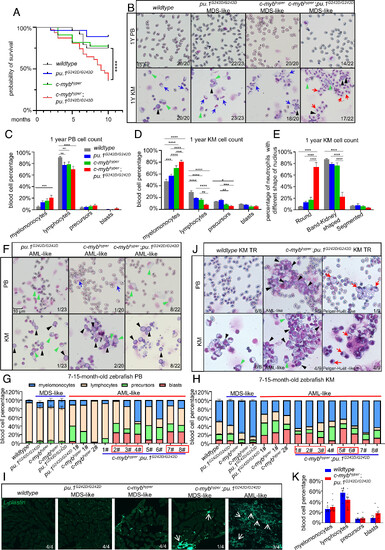
Increased mortality and sAML transformation in c-mybhyper;pu.1G242D/G242D zebrafish. (A) Survival curves of wildtype, c-mybhyper, pu.1G242D/G242D, and c-mybhyper;pu.1G242D/G242D zebrafish (n ≥ 21). (B–D) PB cells and KM blood cells (B) in 1-y-old adult fish stained with May-Grunwald/Giemsa (400×, (black triangles indicate blasts, green triangles precursor, blue arrow normal band/kidney-shaped neutrophils, red arrows PHA-like neutrophils). PB (C) and KM (D) cell counts were manually calculated (n ≥ 20). (E) Proportion of neutrophils with different nuclear morphologies in the four genotypes (n ≥ 10). (F) c-mybhyper, pu.1G242D/G242D, and c-mybhyper;pu.1G242D/G242D zebrafish progressed to AML in adulthood (400×, black cones indicate early myeloid progenitors, blue arrows indicate myeloid cells in PB). (G and H) Bar plot of blood cell classification counts in the PB and KM of 7- to 15-mo-old zebrafish, AML-like sample (blast cells > 20%) are numbered as 1# to 8#. Red boxes indicate c-mybhyper;pu.1G242D/G242D blasts that exceed 20% in either PB or KM. (I) Lcp immunofluorescence confirmed myeloid cell infiltration into muscle tissue (white arrows). (J) Transplantation of c-mybhyper;pu.1G242D/G242D KM blood cells into foxn1−/− recipients recapitulate AML and PHA-like cell phenotypes. (black triangles indicate blasts, green triangles precursor, red arrows PHA-like cell). (K) KM blood cell counts in recipients of wildtype or c-mybhyper;pu.1G242D/G242D KM (n ≥ 20). Numbers in (B, F, I, and J) show zebrafish with representative phenotypes out of the total examined. |

Impact oflmnb1 expression on PHA-like Cells and AML development. (A) CRISPR/Cas9 targeted exon 7 of zebrafish lmnb1. The target sequence is in red, and the PAM sequence in green. The lmnb1 (−4/−4) line has deleted nucleotides, leading to a truncated protein missing the lamin tail domain. (B) lmnb1 mRNA expression in 3 dpf lmnb1 mutants and siblings, detected by qPCR. (C) PHA-like cells in 3-mo-old lmnb1 (−4/−4) zebrafish (blue arrows, green arrows, and red arrows indicate segmented, band/kidney-shaped and round nucleus neutrophil, respectively). (D) Comparation of neutrophils with different shape of nucleus in wt and lmnb1 (−4/−4). The black asterisks indicate statistical difference. (E) KM blood cell morphology in 3-mo-old c-mybhyper;pu.1G242D/G242D and c-mybhyper;pu.1G242D/G242D;lmnb1OE (blue arrows, green arrows, and red arrows indicate segmented, band/kidney-shaped and round nucleus neutrophil, respectively). (F) Comparation of neutrophils with different shape of nucleus in c-mybhyper;pu.1G242D/G242D and c-mybhyper;pu.1G242D/G242D;lmnb1OE. (G) Three 6-mo-old lmnb1KO F0 exhibited an AML-like phenotype in KM (black triangles indicate precursors, AML-like F0 zebrafish were numbered as #1, #2, and #3). (H) Calculation of different blood cell types in 6-mo-old wildtype and lmnb1KO F0 zebrafish. (I) The expression of lmnb1 in 3 AML-like lmnb1KO F0 KM blood cells was detected by qPCR. (J) Blasts increased in 3-mo-old lmnb1 (−4/−4) zebrafish (green arrows, red arrows, black triangles, and green triangles indicate lymphocytes, myelomonocytes, blasts, and precursors, respectively). (K) Calculation of different blood cell types in 3-mo-old wildtype and lmnb1 (−4/−4) zebrafish. (L) Calculation of different blood cell types in 3-mo-old c-mybhyper;pu.1G242D/G242D and c-mybhyper;pu.1G242D/G242D;lmnb1OE. |

The c-mybhyper;pu.1G242D/G242D MDS/sAML model responds to the combination of all-trans retinoic acid and cytarabine treatment. (A) Flowchart for drug treatment in wt, c-mybhyper, pu.1G242D/G242D, and c-mybhyper;pu.1G242D/G242D embryos. (B) The combination treatment of Ara-C and ATRA decreased the number of neutrophils in the CHT region as determined by SB staining. (C) Average numbers of SB+ cells per embryo with drug treatment at 5 dpf (n ≥ 12). |

Schematic of the synergistic effect of c-Myb hyperactivation and Pu.1 deficiency in promoting sAML transformation. |