
|
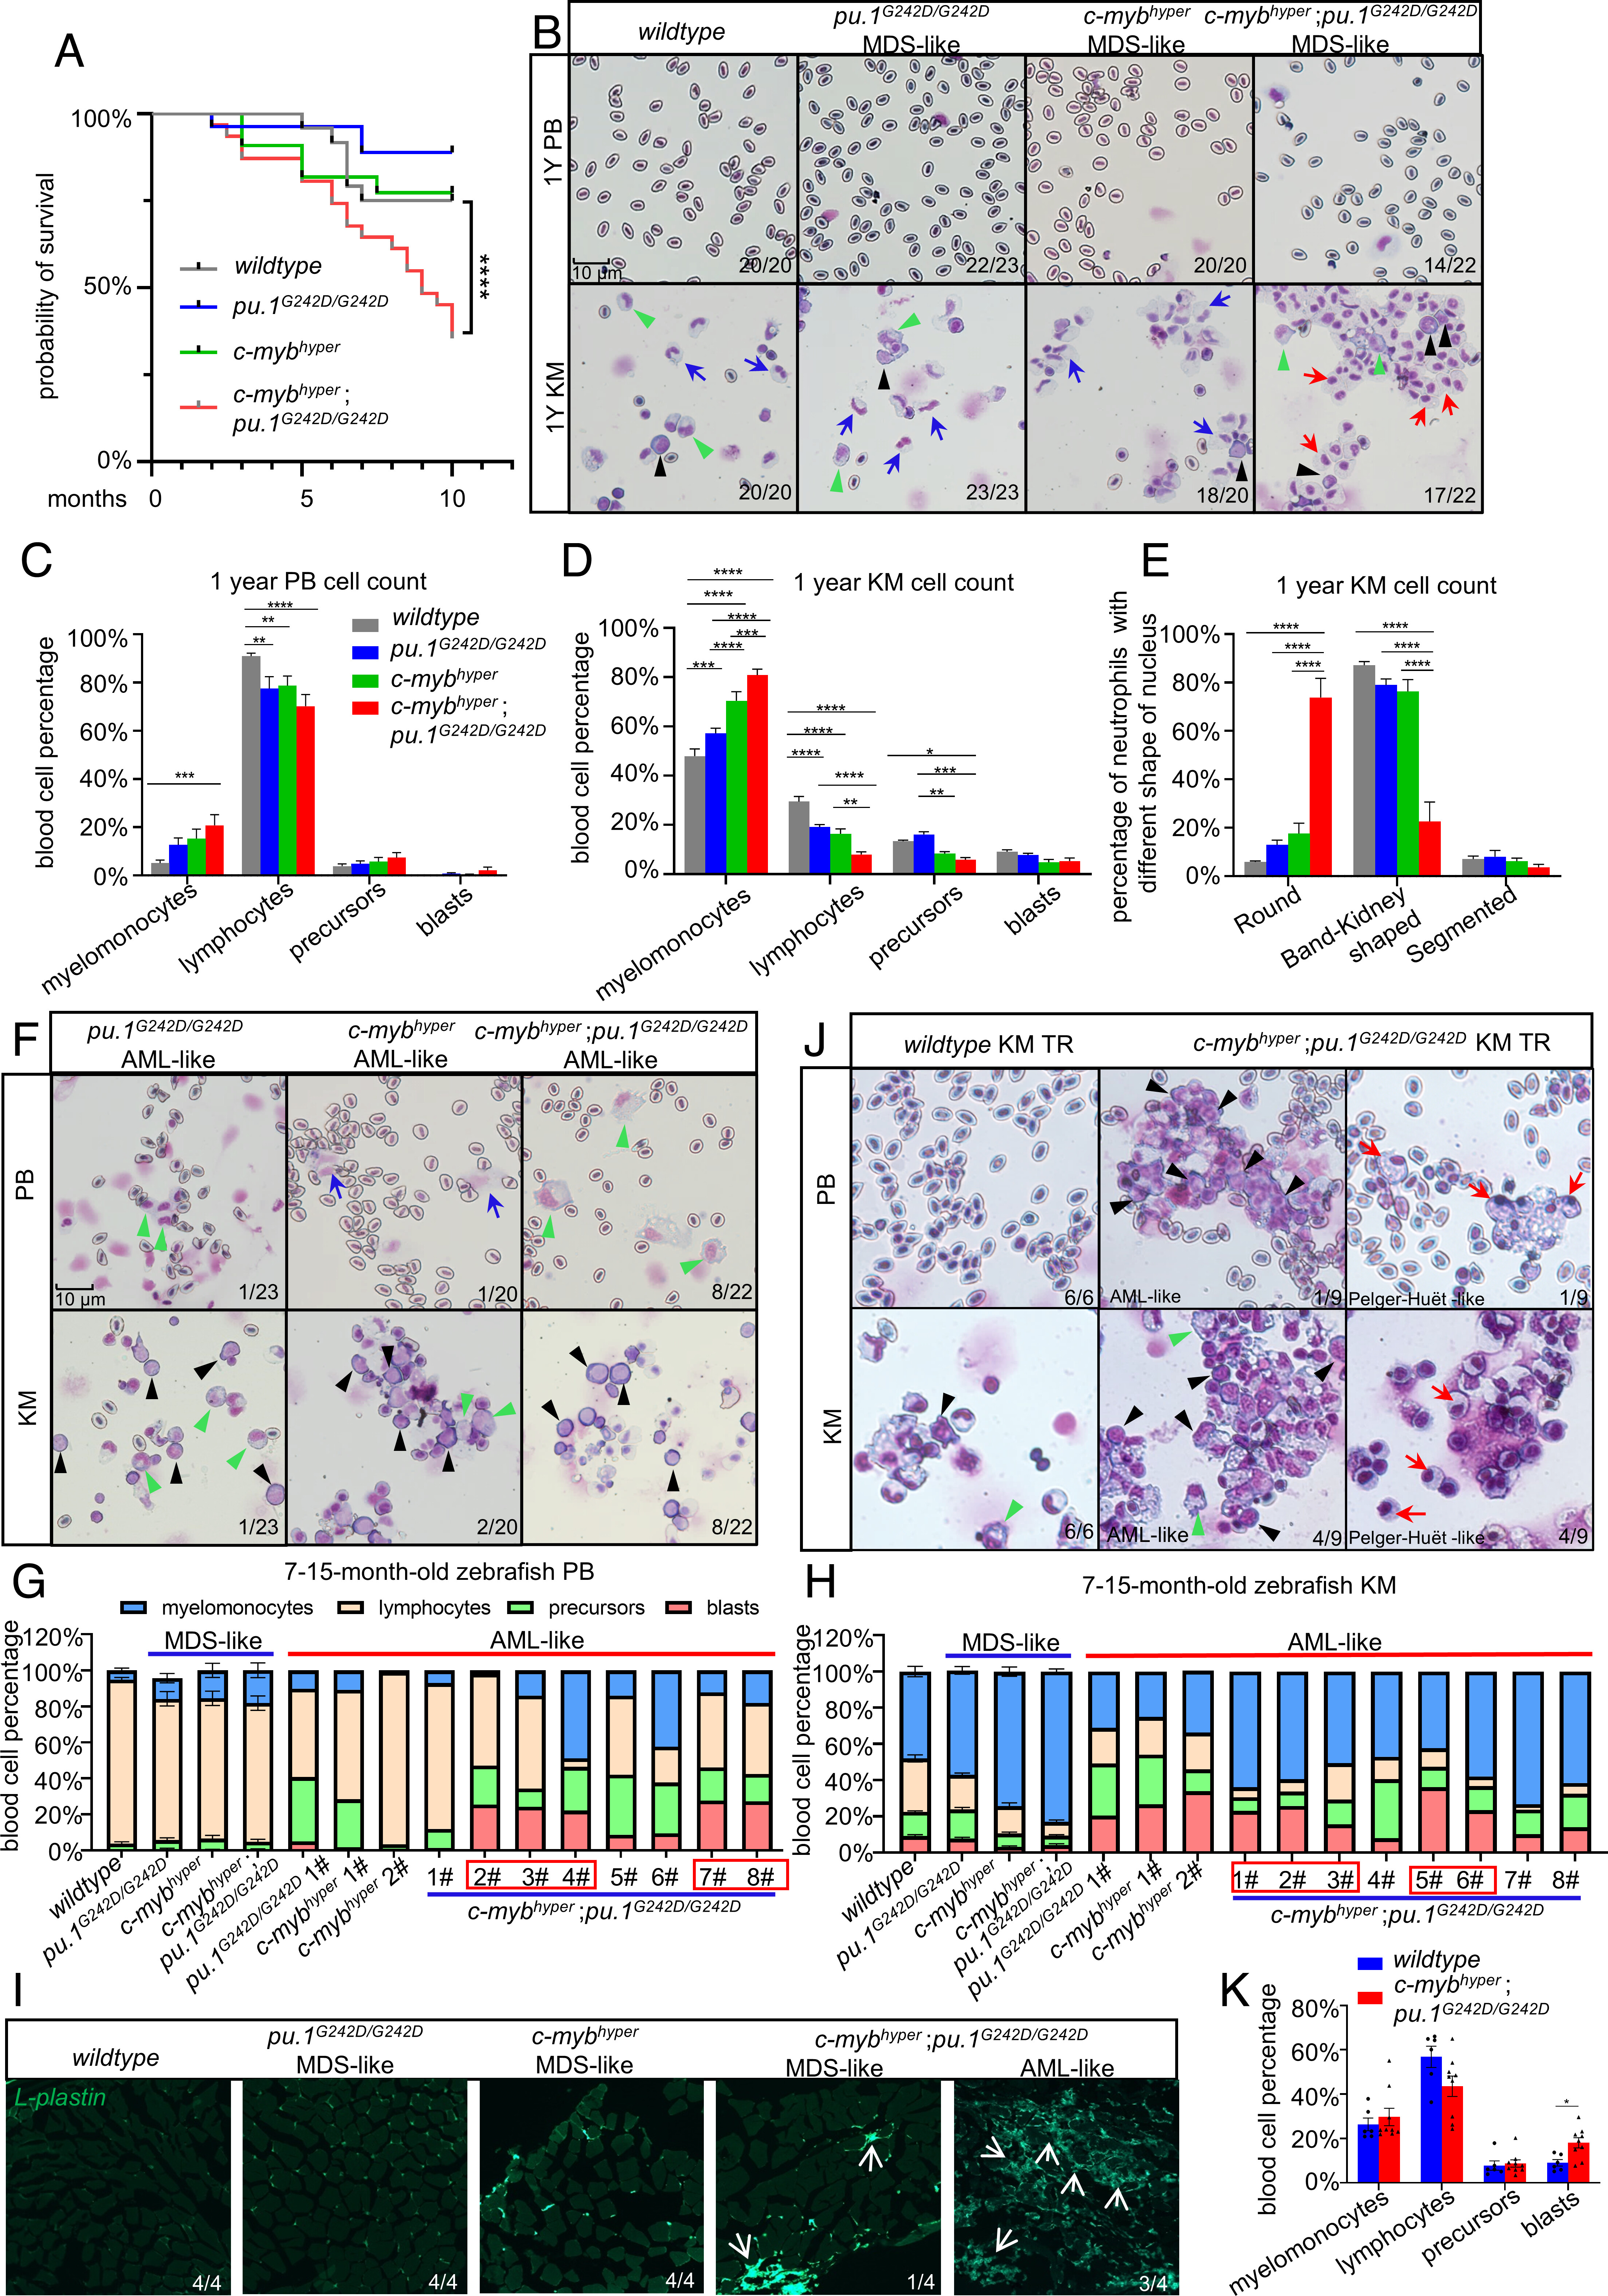
Fig. 5 Increased mortality and sAML transformation in c-mybhyper;pu.1G242D/G242D zebrafish. (A) Survival curves of wildtype, c-mybhyper, pu.1G242D/G242D, and c-mybhyper;pu.1G242D/G242D zebrafish (n ≥ 21). (B–D) PB cells and KM blood cells (B) in 1-y-old adult fish stained with May-Grunwald/Giemsa (400×, (black triangles indicate blasts, green triangles precursor, blue arrow normal band/kidney-shaped neutrophils, red arrows PHA-like neutrophils). PB (C) and KM (D) cell counts were manually calculated (n ≥ 20). (E) Proportion of neutrophils with different nuclear morphologies in the four genotypes (n ≥ 10). (F) c-mybhyper, pu.1G242D/G242D, and c-mybhyper;pu.1G242D/G242D zebrafish progressed to AML in adulthood (400×, black cones indicate early myeloid progenitors, blue arrows indicate myeloid cells in PB). (G and H) Bar plot of blood cell classification counts in the PB and KM of 7- to 15-mo-old zebrafish, AML-like sample (blast cells > 20%) are numbered as 1# to 8#. Red boxes indicate c-mybhyper;pu.1G242D/G242D blasts that exceed 20% in either PB or KM. (I) Lcp immunofluorescence confirmed myeloid cell infiltration into muscle tissue (white arrows). (J) Transplantation of c-mybhyper;pu.1G242D/G242D KM blood cells into foxn1−/− recipients recapitulate AML and PHA-like cell phenotypes. (black triangles indicate blasts, green triangles precursor, red arrows PHA-like cell). (K) KM blood cell counts in recipients of wildtype or c-mybhyper;pu.1G242D/G242D KM (n ≥ 20). Numbers in (B, F, I, and J) show zebrafish with representative phenotypes out of the total examined.