
|
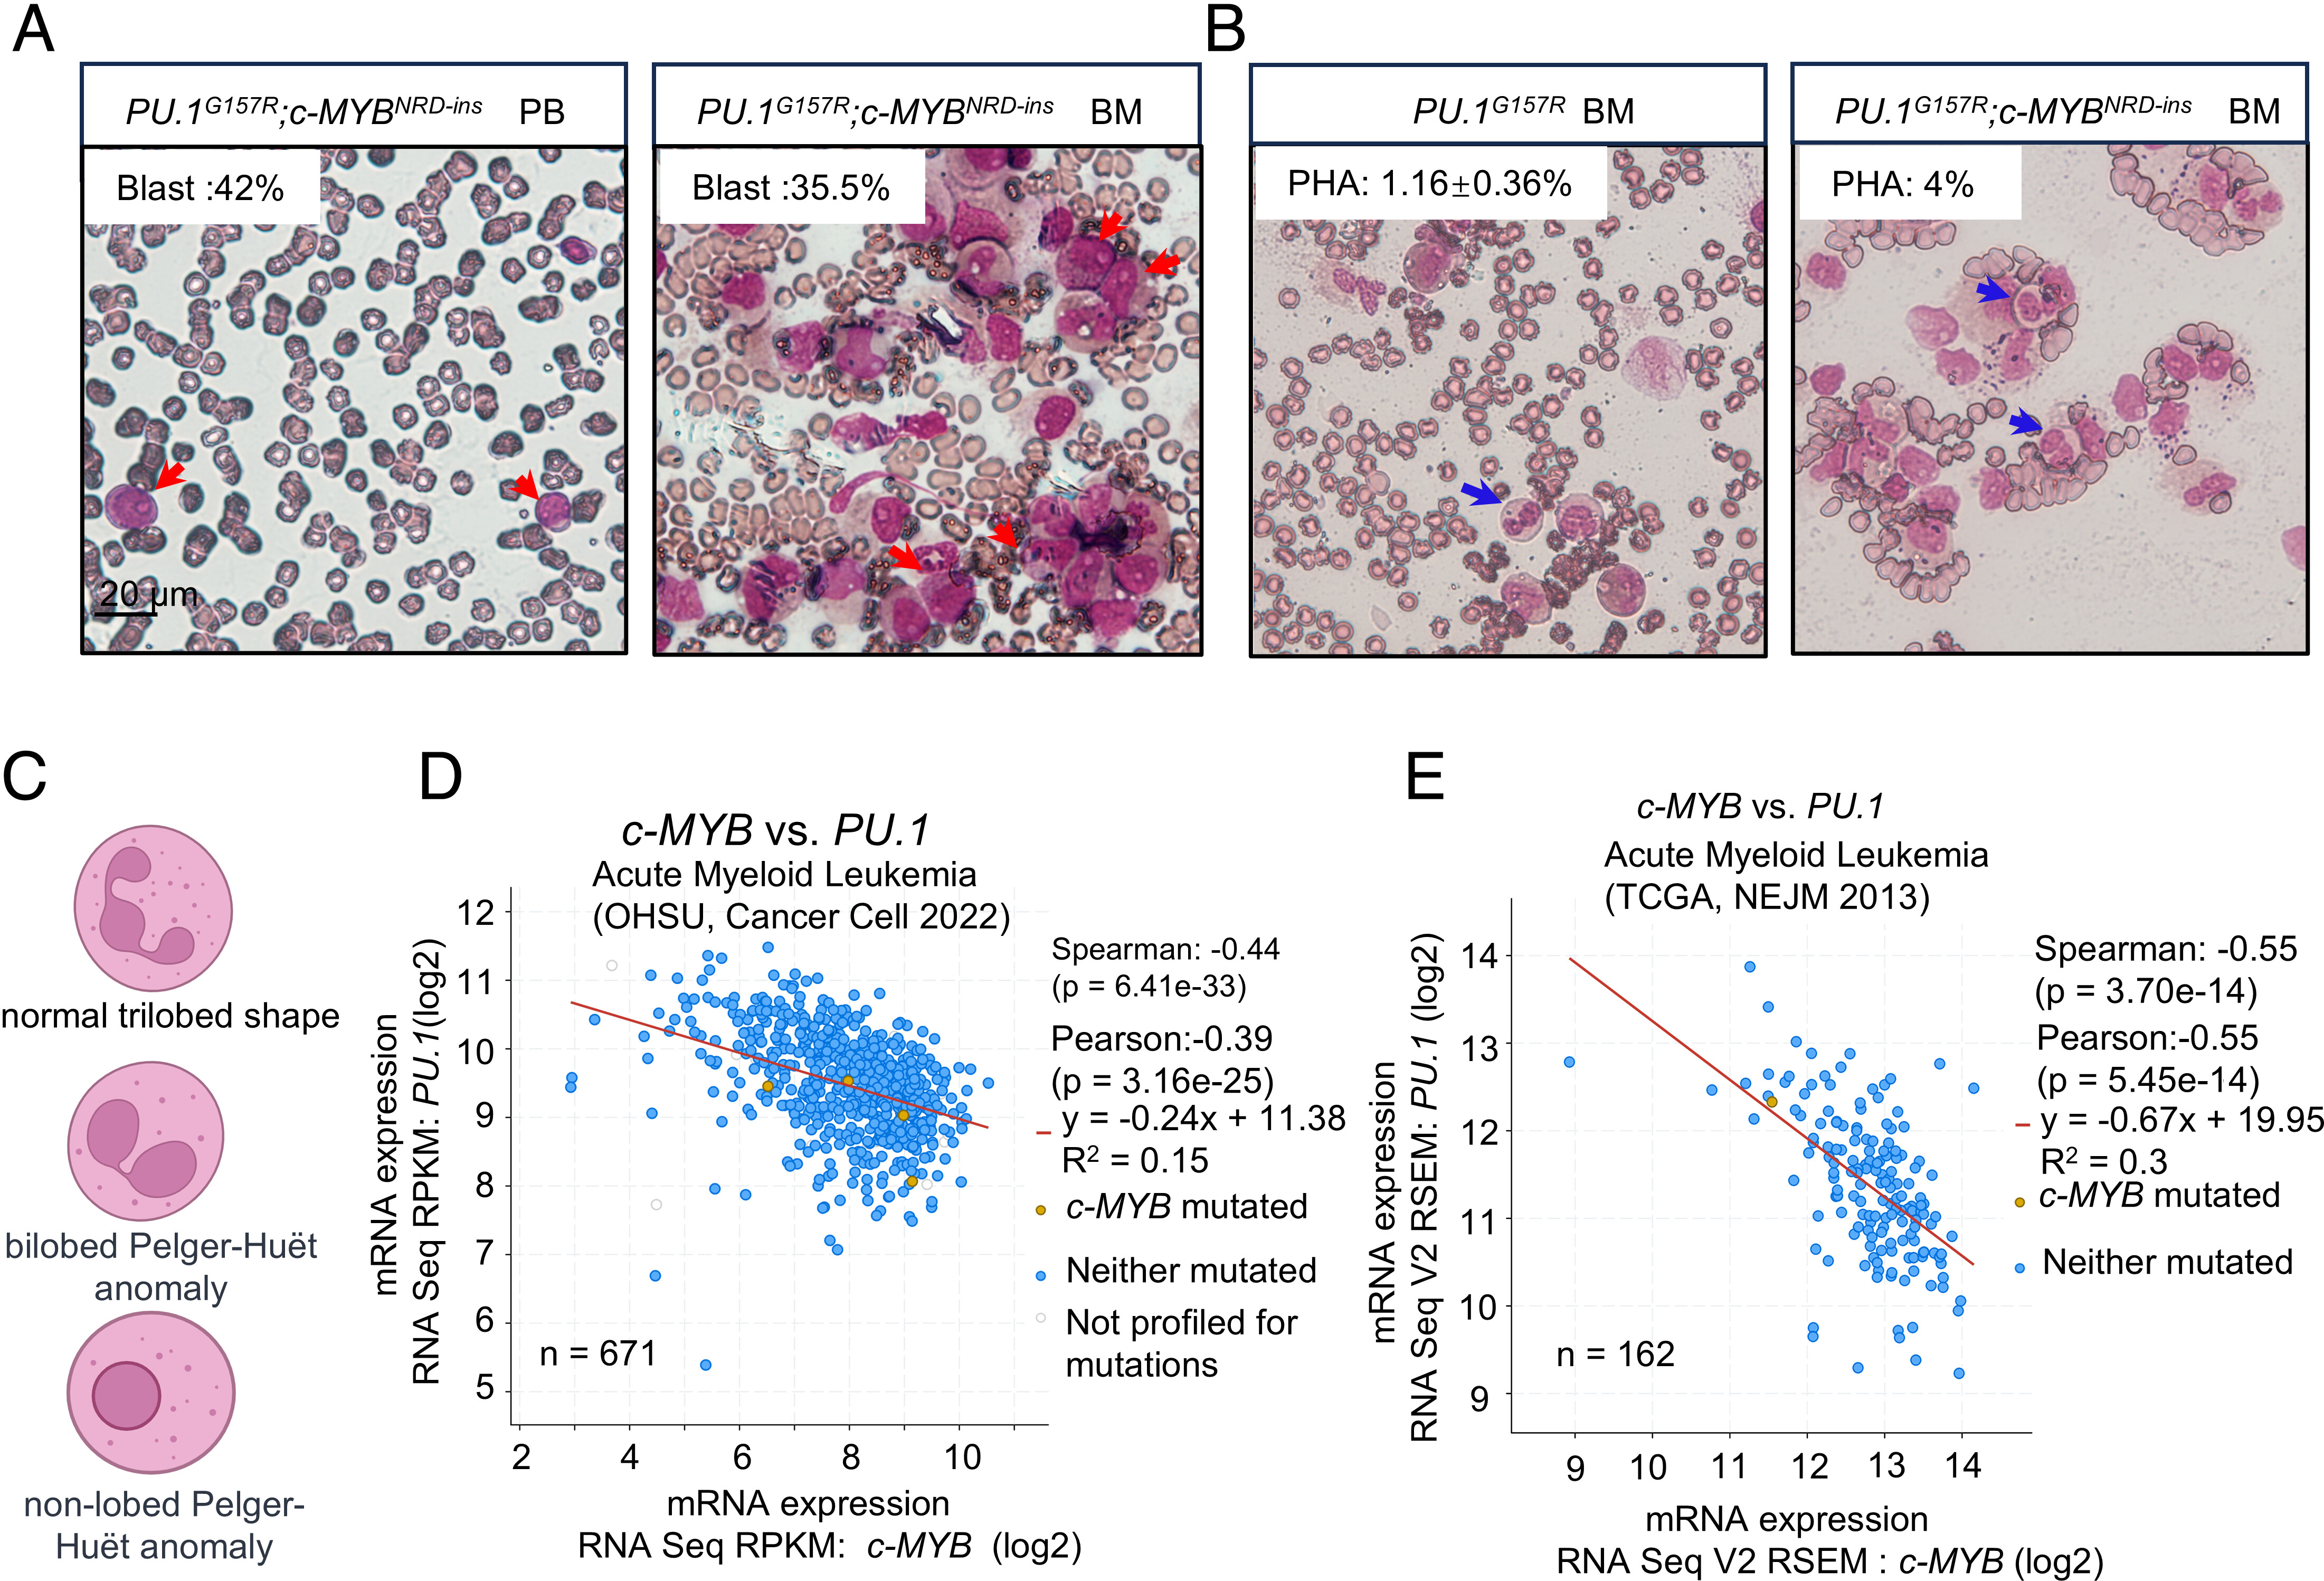
Fig. 1 c-MYB and PU.1 mutated in a high-risk AML patient and reversed expressed in AML patients. (A) Blast cells in PB and bone marrow of AML patients(400×, red arrows indicate myeloid blasts). (B) Proportion of PHA cells in the bone marrow of AML patients with PU.1G15R or PU.1G157R; c-MYBNRD-ins variants after treatment (400×, blue arrows indicate PHA cells, mean ± SE). (C) Schematic of a normal trilobed neutrophil, bilobed PHA cell, and nonlobed PHA cell (graphical elements sourced from https://www.biorender.com/). (D and E) Correlation analysis of c-MYB and PU.1 expression in acute myeloid leukemia (AML) patients. The Spearman’s and Pearson’s correlation coefficients of c-MYB and PU.1 expression in 671 AML (Spearman’s: P = 6.41e-33, R = −0.44; Pearson’s: P = 3.16e-25, R = −0.39) (D) and 162 AML (Spearman’s: P = 3.70e-14, R = −0.55; Pearson’s: P = 5.45e-14, R = −0.55) (E) patients were measured.