FIGURE SUMMARY
Title

Transcriptomic neuron types vary topographically in function and morphology

Authors
Shainer, I., Kappel, J.M., Laurell, E., Donovan, J.C., Schneider, M.W., Kuehn, E., Arnold-Ammer, I., Stemmer, M., Larsch, J., Baier, H.
Source
Full text @ Nature

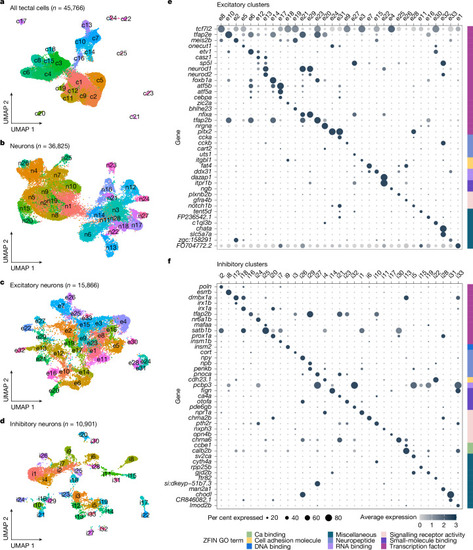
scRNA-seq of the OT reveals a multitude of neuronal types.

a, Sequenced tectal cells clustered according to similarity of gene expression; 25 distinct clusters were identified. Each dot represents a single cell, colour coded according to cluster identity. b, Postmitotic neurons (clusters expressing elavl3) were subsetted and reclustered to further identify the various types of excitatory and inhibitory neurons. c, Excitatory neurons reclustered according to similarity of gene expression. d, Inhibitory neurons reclustered according to similarity of gene expression. e, Dot plot of the highly differentially expressed genes for each of the excitatory cell types (clusters e1–e33). Differentially expressed genes were grouped according to their molecular function and annotated according to ZFIN Gene Ontology terminology58. f, Dot plot of the highly differentially expressed genes for each of the inhibitory cell types (clusters: i1–i33).

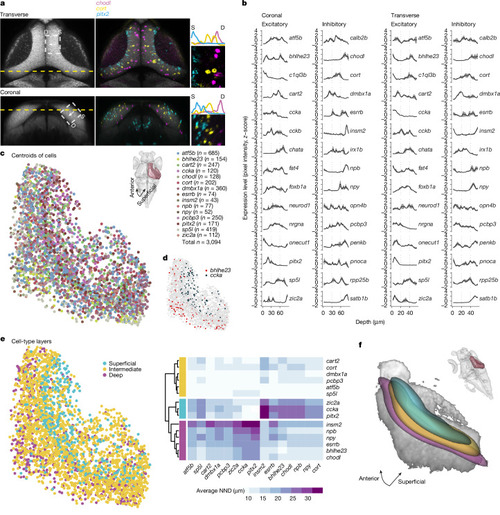
Cell bodies of transcriptomic clusters form anatomical layers in the SPV orthogonal to the retinotopic map.

a, Multiplexed in situ HCR of selected marker genes were registered to the standard brain atlas at mapzebrain.org. We measured expression level by examining the pixel intensity profile of each gene in the same transverse (top, projection of planes z289–z291) and coronal (left, projection of planes x463–x465) section. Left, the area in which pixel intensity is measured is indicated with a white dashed rectangle and confined to the SPV (S, superficial; D, deep). Middle and right, expression pattern example in a single fish. b, The z-scored pixel intensity of selected inhibitory and excitatory marker genes. The black line represents the average (n = 3 fish, simple moving average with window size = 3); the grey shaded region represents the s.e.m. c, Bottom left, centroids of cells expressing selected t-type markers located within the SPV. Top right, dorsal view with the right hemisphere SPV highlighted in burgundy, representing the labelled area of the centroids in the tectal coordinate system. d, The labelled centroids of cells expressing bhlhe23 and ccka, demonstrating the segregation of these cells along the tectum in 3D. e, The distance from each cell of a given t-type to its nearest neighbour (NND) of all other t-types was measured in 3D. Hierarchical clustering of the average NND for each t-type revealed three molecular layers in the SPV. f, Bottom left, 3D visualization of thresholded gaussian kernel densities for the three molecular layers from e. Top right, the viewing angle relative to the whole brain.

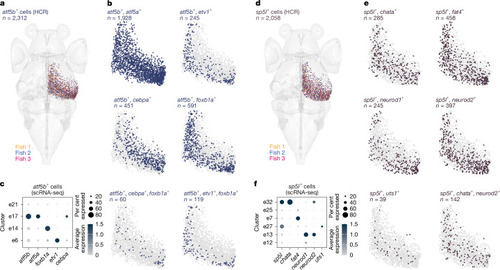
Combinatorial expression of t-type marker genes separates subtypes along the anatomical axes of the OT.

a, atf5b-expressing cells were labelled in three individual larvae and patterns were coregistered (total n = 2,312 cells). b, Combinatorial expression of marker genes within the atf5b-expressing cells. atf5b+ etv1+ cells were found in the deep SPV region, whereas atf5b+cebpa+ cells were localized to the superficial region with highest density towards the posterior zone. c, scRNA-seq data for clusters expressing atf5b. d, sp5l-expressing cells were labelled from 3 individual larvae (total n = 2,058). e, Combinatorial expression of marker genes among the sp5l-expressing cells. sp5l+chata+ cells were found in the intermediate SPV region. sp5l+neurod1+ cells were found in the intermediate and deep regions, with highest density towards the posterior zone. sp5l+ uts1+ cells represented a rare population located in the intermediate SPV region. f, scRNA-seq data for clusters expressing sp5l.

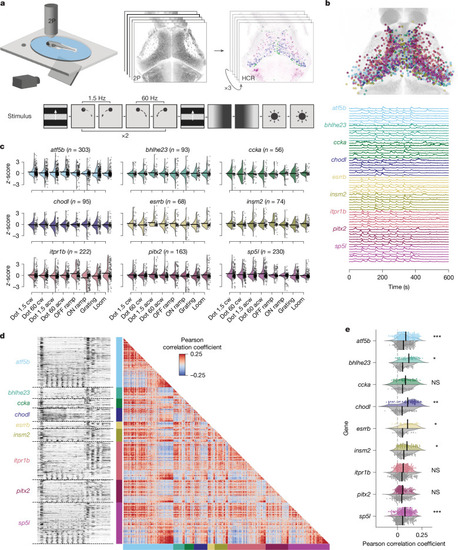
Neurons of a specific t-type show diverse visual responses and form coherent functional subclusters.

a, Experimental procedure: 6 dpf larvae were exposed to a battery of visual stimuli while volumetric functional 2-photon calcium imaging (2P) was performed covering most neurons of the tectum. The larvae were then stained in consecutive rounds for up to six marker gene mRNAs using HCR labelling. The larva illustration was modified from ref. 59. b, Top, result of aligning functional and HCR brain volumes and registering all ROIs that overlap with one of 9 marker genes into a common anatomical reference frame (1,304 ROIs, n = 6). Bottom, example traces of each labelled t-type selected for responsiveness to local motion. c, Average t-type response scores to the visual stimulus sequence scaled to unit variance and zero mean of overall tectal population. Most t-types showed increased or decreased responses to at least two different stimuli. acw, anticlockwise; cw, clockwise. d, Left, raw calcium traces of all 1,304 t-type+ functional ROIs sorted by first t-type and within t-type by response score to local motion. Responses to global motion (beginning, end) and local motion (middle section) are visible in all t-types. Right, correlation matrix of all pairwise correlations using Pearson correlation coefficient. Red and blue clusters of positively and negatively correlated neurons are found between and within all t-types. e, Mean pairwise correlations of each neuron with all neurons of the same t-type (colour) and all neurons (grey) of other t-types. Within t-type correlation is significantly increased for six out of nine tested t-types. Two-sided Student’s t-test, Bonferroni-corrected. P values: atf5b, 3.053 × 10−4; bhlhe23, 1.367 × 10−2; ccka, 1.443 × 10−1; chodl, 5.043 × 10−3; esrrb, 3.769 × 10−2; insm2, 1.556 × 10−2; itpr1b, 1.653 × 10−1; pitx2, 3.703 × 100sp5l: 1.076 × 10−4. *P < 0.05, **P < 0.01, ***P < 0.001. NS, not significant.

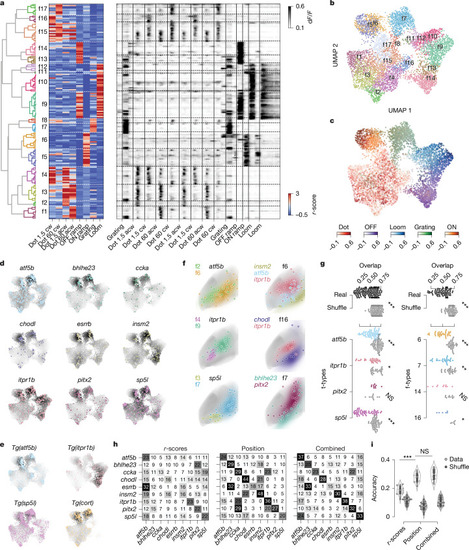
Localization in functional and anatomical space varies between t-types.

a, Hierarchical clustering of all strongly responding tectal neurons (n = 7,094) to identify functional cell types (f-types). Left, dendrogram of clustering all 169 exemplars that were identified using affinity propagation. Middle, heat map showing response vectors of all exemplars based on visual stimuli. Functional clusters and exemplars are primarily divided into local (clusters 1–4 and 15–17) versus global (clusters 5–14) motion responses. Right, raw calcium traces of all exemplars. b, UMAP embedding based on response vectors, overlaid with colour code according to f-type assignment. c, UMAP embedding of all responding neurons from b, with five different colour codes based on the preferred respective responses of the five superclusters. d, t-types accumulate locally in functional space. Response vectors of each transcriptomically identified neuron transformed into the UMAP embedding. The colour code of UMAP represents the kernel density estimate of the respective t-type. e, Response vectors of neurons recorded in transgenic fish, mapped into the same UMAP embedding largely confirm the enrichments observed in d. f, Anatomical localization of t/f-clusters within t-types and f-types. Dots represent individual ROIs, coloured areas show KDEs of t/f-clusters. ROIs of the same t-type (left) and f-type (right) comprise anatomically separated clusters based on functional (left) and transcriptomic (right) identity. All ROIs mirrored to the left tectal hemisphere. t-type is based on HCR labelling. g, t/f-clusters are significantly separated in anatomical tectal space within t-types and f-types. Left, pairwise KDE overlap values for cell types of different functional clusters for real data and shuffled t-type labels. Right, as left but for different t-types within functional clusters. Mean pairwise overlap values of t/f-clusters across t-types and across f-types are significantly lower than respective shuffled controls, respectively, indicating anatomical separation of cell types within functional clusters. Two-sided Mann–Whitney U-test, Bonferroni-corrected. P values: t-types overall, 3.353 × 10−22; atf5b, 5.598 × 10−11; itpr1b, 2.203 × 10−4; pitx2, 9.370 × 10−1; sp5l, 2.662 × 10−9; clusters overall, 2.230 × 10−14; c6, 1.822 × 10−7; c7, 2.641 × 10−4; c14, 4.032 × 10−3; c16, 3.463 × 10−2. h, Confusion matrices of three SVM classifiers predicting transcriptomic identity on the basis of functional response vectors (r-scores), cell body position or both combined. Numbers and saturation indicate the true-positive rate. Predictive performance increases from left to right, indicated by the saturation of the diagonal (true-positive predictions per cell type). i, Accuracy of SVM classifier performances from h (grey dots and violin plots). Classifiers could recover t-type identity based on functional response vectors in about one out of five cases (accuracy = 0.187 ± 0.027, n = 19), for anatomical space accuracy was significantly higher (accuracy = 0.276 ± 0.030, n = 19, two-sided Mann–Whitney U-test; P value = 1.358 × 10−7). Combining both spaces did not significantly improve performance compared with anatomical space alone (accuracy = 0.296 ± 0.036, n = 19, two-sided Mann–Whitney U-test, P value = 0.113). For all classifiers, negative controls with shuffled cell-type labels resulted in significantly lower performance (grey dots and violin plots; two-sided Mann–Whitney U-test, P values: r-score, 1.881 × 10−7; position, 6.532 × 10−8; combined, 6.532 × 10−8).

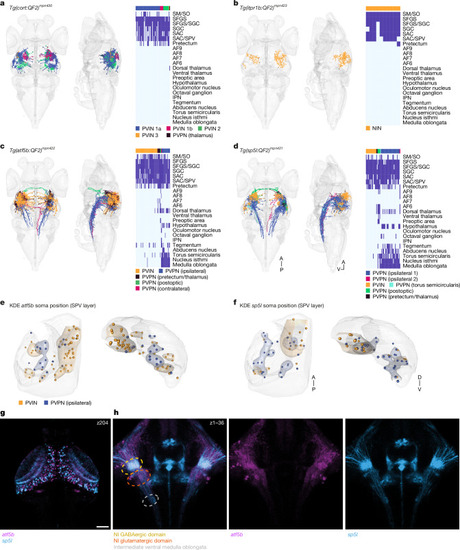
Neurons of a specific t-type may assume distinct morphologies and projection patterns.

a, Sparsely labelled cort neurons were registered into the standard brain (n = 62). Right, anatomical matrix. AF, arborization field; IPN, interpeduncular nucleus; SAC, stratum album centrale; SGC, stratum griseum centrale; SM, stratum marginale; SO, stratum opticum. b, Sparsely labelled itpr1b neurons were registered into the standard brain (n = 10). Right, anatomical matrix. NIN, neuropil interneurons. c, Sparsely labelled atf5b neurons were registered into the standard brain (n = 77). Neurons are colour coded according to their m-type. Right, anatomical matrix. d, Sparsely labelled sp5l+ neurons were registered into the standard brain (n = 53). Right, anatomical matrix. A, anterior; P, posterior; V, ventral. e, atf5b interneurons (n = 49) and ipsilateral neurons (n = 18) were mirrored to the left hemisphere, and a KDE was measured according to their soma position, revealing separation of m-types along the anterior–posterior and dorsal–ventral axes. Transverse and coronal views of the SPV layer are shown. f, sp5l interneurons (n = 16) and ipsilateral neurons (n = 29) were mirrored to the left hemisphere, and a KDE was measured according to their soma position, revealing separation of m-types along the anterior–posterior and dorsal–ventral axes. g, Registered confocal stack of atf5b and sp5l transgenic fish. A single fish example of each transgenic line out of three specimens imaged. A single focal plane spanning the OT is shown. Scale bar, 50 μm. h, z-projection of the nucleus isthmi (NI) area, showing atf5b and sp5l projections forming collaterals at different parts of the nucleus isthmi.

Acknowledgments
This image is the copyrighted work of the attributed author or publisher, and ZFIN has permission only to display this image to its users. Additional permissions should be obtained from the applicable author or publisher of the image. Full text @ Nature