IMAGE

Fig. 1

ID
ZDB-IMAGE-250228-32
Source
Figures for Shainer et al., 2025
Image
Figure Caption

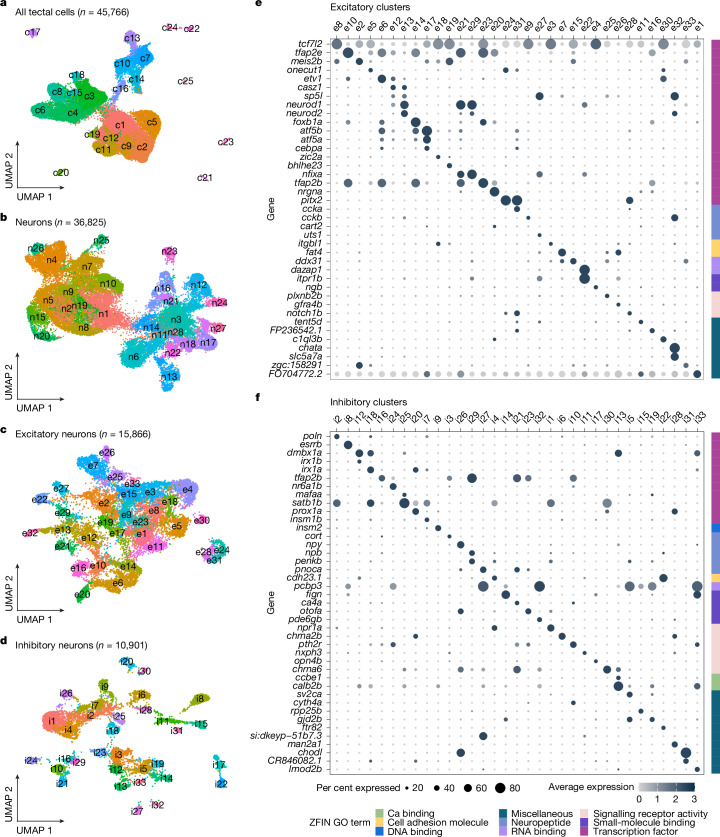
Fig. 1 scRNA-seq of the OT reveals a multitude of neuronal types.

a, Sequenced tectal cells clustered according to similarity of gene expression; 25 distinct clusters were identified. Each dot represents a single cell, colour coded according to cluster identity. b, Postmitotic neurons (clusters expressing elavl3) were subsetted and reclustered to further identify the various types of excitatory and inhibitory neurons. c, Excitatory neurons reclustered according to similarity of gene expression. d, Inhibitory neurons reclustered according to similarity of gene expression. e, Dot plot of the highly differentially expressed genes for each of the excitatory cell types (clusters e1–e33). Differentially expressed genes were grouped according to their molecular function and annotated according to ZFIN Gene Ontology terminology58. f, Dot plot of the highly differentially expressed genes for each of the inhibitory cell types (clusters: i1–i33).

Acknowledgments
This image is the copyrighted work of the attributed author or publisher, and ZFIN has permission only to display this image to its users. Additional permissions should be obtained from the applicable author or publisher of the image. Full text @ Nature