|
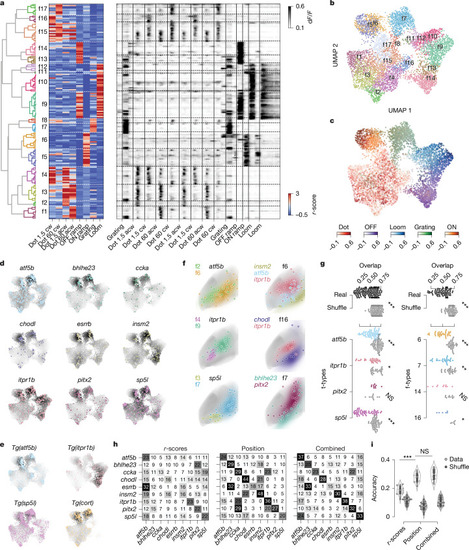
Localization in functional and anatomical space varies between t-types. a, Hierarchical clustering of all strongly responding tectal neurons (n = 7,094) to identify functional cell types (f-types). Left, dendrogram of clustering all 169 exemplars that were identified using affinity propagation. Middle, heat map showing response vectors of all exemplars based on visual stimuli. Functional clusters and exemplars are primarily divided into local (clusters 1–4 and 15–17) versus global (clusters 5–14) motion responses. Right, raw calcium traces of all exemplars. b, UMAP embedding based on response vectors, overlaid with colour code according to f-type assignment. c, UMAP embedding of all responding neurons from b, with five different colour codes based on the preferred respective responses of the five superclusters. d, t-types accumulate locally in functional space. Response vectors of each transcriptomically identified neuron transformed into the UMAP embedding. The colour code of UMAP represents the kernel density estimate of the respective t-type. e, Response vectors of neurons recorded in transgenic fish, mapped into the same UMAP embedding largely confirm the enrichments observed in d. f, Anatomical localization of t/f-clusters within t-types and f-types. Dots represent individual ROIs, coloured areas show KDEs of t/f-clusters. ROIs of the same t-type (left) and f-type (right) comprise anatomically separated clusters based on functional (left) and transcriptomic (right) identity. All ROIs mirrored to the left tectal hemisphere. t-type is based on HCR labelling. g, t/f-clusters are significantly separated in anatomical tectal space within t-types and f-types. Left, pairwise KDE overlap values for cell types of different functional clusters for real data and shuffled t-type labels. Right, as left but for different t-types within functional clusters. Mean pairwise overlap values of t/f-clusters across t-types and across f-types are significantly lower than respective shuffled controls, respectively, indicating anatomical separation of cell types within functional clusters. Two-sided Mann–Whitney U-test, Bonferroni-corrected. P values: t-types overall, 3.353 × 10⁻²²; atf5b, 5.598 × 10⁻¹¹; itpr1b, 2.203 × 10⁻⁴; pitx2, 9.370 × 10⁻¹; sp5l, 2.662 × 10⁻⁹; clusters overall, 2.230 × 10⁻¹⁴; c6, 1.822 × 10⁻⁷; c7, 2.641 × 10⁻⁴; c14, 4.032 × 10⁻³; c16, 3.463 × 10⁻². h, Confusion matrices of three SVM classifiers predicting transcriptomic identity on the basis of functional response vectors (r-scores), cell body position or both combined. Numbers and saturation indicate the true-positive rate. Predictive performance increases from left to right, indicated by the saturation of the diagonal (true-positive predictions per cell type). i, Accuracy of SVM classifier performances from h (grey dots and violin plots). Classifiers could recover t-type identity based on functional response vectors in about one out of five cases (accuracy = 0.187 ± 0.027, n = 19), for anatomical space accuracy was significantly higher (accuracy = 0.276 ± 0.030, n = 19, two-sided Mann–Whitney U-test; P value = 1.358 × 10⁻⁷). Combining both spaces did not significantly improve performance compared with anatomical space alone (accuracy = 0.296 ± 0.036, n = 19, two-sided Mann–Whitney U-test, P value = 0.113). For all classifiers, negative controls with shuffled cell-type labels resulted in significantly lower performance (grey dots and violin plots; two-sided Mann–Whitney U-test, P values: r-score, 1.881 × 10⁻⁷; position, 6.532 × 10⁻⁸; combined, 6.532 × 10⁻⁸).
|