|
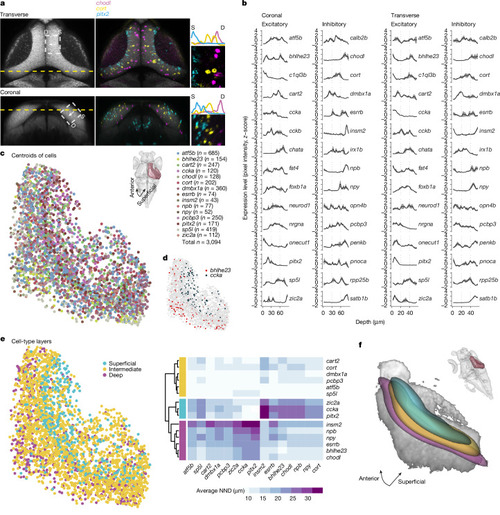
Cell bodies of transcriptomic clusters form anatomical layers in the SPV orthogonal to the retinotopic map. a, Multiplexed in situ HCR of selected marker genes were registered to the standard brain atlas at mapzebrain.org. We measured expression level by examining the pixel intensity profile of each gene in the same transverse (top, projection of planes z289–z291) and coronal (left, projection of planes x463–x465) section. Left, the area in which pixel intensity is measured is indicated with a white dashed rectangle and confined to the SPV (S, superficial; D, deep). Middle and right, expression pattern example in a single fish. b, The z-scored pixel intensity of selected inhibitory and excitatory marker genes. The black line represents the average (n = 3 fish, simple moving average with window size = 3); the grey shaded region represents the s.e.m. c, Bottom left, centroids of cells expressing selected t-type markers located within the SPV. Top right, dorsal view with the right hemisphere SPV highlighted in burgundy, representing the labelled area of the centroids in the tectal coordinate system. d, The labelled centroids of cells expressing bhlhe23 and ccka, demonstrating the segregation of these cells along the tectum in 3D. e, The distance from each cell of a given t-type to its nearest neighbour (NND) of all other t-types was measured in 3D. Hierarchical clustering of the average NND for each t-type revealed three molecular layers in the SPV. f, Bottom left, 3D visualization of thresholded gaussian kernel densities for the three molecular layers from e. Top right, the viewing angle relative to the whole brain.
|