IMAGE

Fig. 4

ID
ZDB-IMAGE-250228-35
Source
Figures for Shainer et al., 2025
Image
Figure Caption

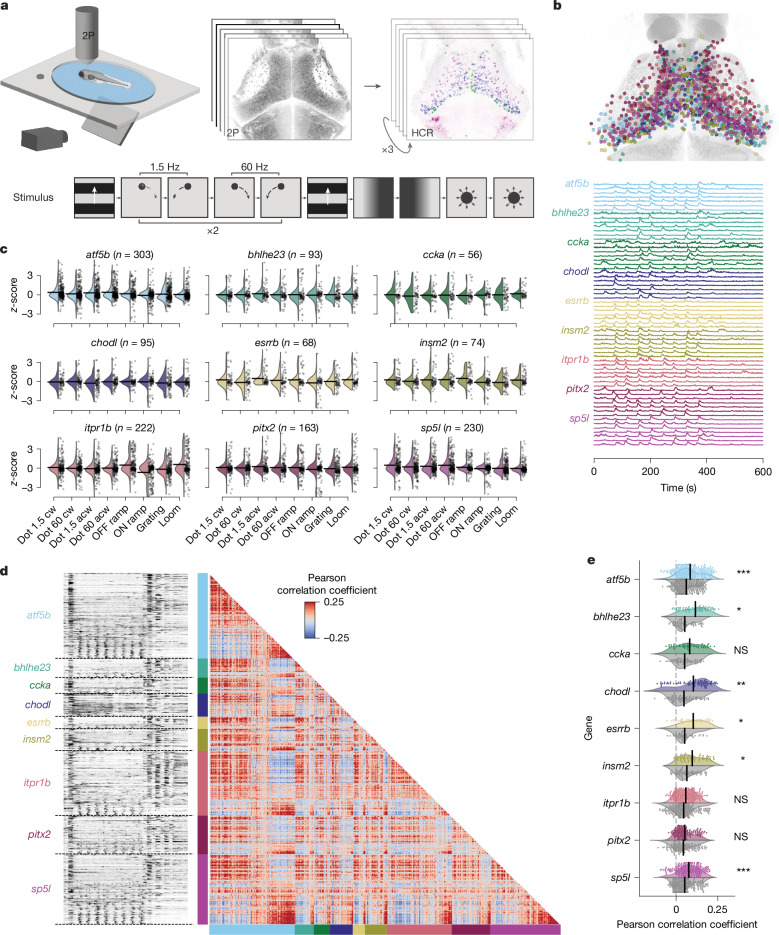
Fig. 4 Neurons of a specific t-type show diverse visual responses and form coherent functional subclusters.

a, Experimental procedure: 6 dpf larvae were exposed to a battery of visual stimuli while volumetric functional 2-photon calcium imaging (2P) was performed covering most neurons of the tectum. The larvae were then stained in consecutive rounds for up to six marker gene mRNAs using HCR labelling. The larva illustration was modified from ref. 59. b, Top, result of aligning functional and HCR brain volumes and registering all ROIs that overlap with one of 9 marker genes into a common anatomical reference frame (1,304 ROIs, n = 6). Bottom, example traces of each labelled t-type selected for responsiveness to local motion. c, Average t-type response scores to the visual stimulus sequence scaled to unit variance and zero mean of overall tectal population. Most t-types showed increased or decreased responses to at least two different stimuli. acw, anticlockwise; cw, clockwise. d, Left, raw calcium traces of all 1,304 t-type+ functional ROIs sorted by first t-type and within t-type by response score to local motion. Responses to global motion (beginning, end) and local motion (middle section) are visible in all t-types. Right, correlation matrix of all pairwise correlations using Pearson correlation coefficient. Red and blue clusters of positively and negatively correlated neurons are found between and within all t-types. e, Mean pairwise correlations of each neuron with all neurons of the same t-type (colour) and all neurons (grey) of other t-types. Within t-type correlation is significantly increased for six out of nine tested t-types. Two-sided Student’s t-test, Bonferroni-corrected. P values: atf5b, 3.053 × 10−4; bhlhe23, 1.367 × 10−2; ccka, 1.443 × 10−1; chodl, 5.043 × 10−3; esrrb, 3.769 × 10−2; insm2, 1.556 × 10−2; itpr1b, 1.653 × 10−1; pitx2, 3.703 × 100sp5l: 1.076 × 10−4. *P < 0.05, **P < 0.01, ***P < 0.001. NS, not significant.

Acknowledgments
This image is the copyrighted work of the attributed author or publisher, and ZFIN has permission only to display this image to its users. Additional permissions should be obtained from the applicable author or publisher of the image. Full text @ Nature