FIGURE

Fig. 3

ID
ZDB-FIG-250228-31
Publication
Shainer et al., 2025 - Transcriptomic neuron types vary topographically in function and morphology
Other Figures
All Figure Page
Back to All Figure Page
Fig. 3

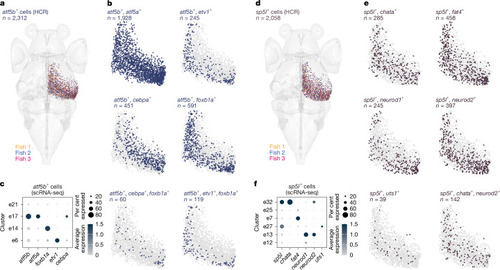
Combinatorial expression of t-type marker genes separates subtypes along the anatomical axes of the OT.

a, atf5b-expressing cells were labelled in three individual larvae and patterns were coregistered (total n = 2,312 cells). b, Combinatorial expression of marker genes within the atf5b-expressing cells. atf5b+ etv1+ cells were found in the deep SPV region, whereas atf5b+cebpa+ cells were localized to the superficial region with highest density towards the posterior zone. c, scRNA-seq data for clusters expressing atf5b. d, sp5l-expressing cells were labelled from 3 individual larvae (total n = 2,058). e, Combinatorial expression of marker genes among the sp5l-expressing cells. sp5l+chata+ cells were found in the intermediate SPV region. sp5l+neurod1+ cells were found in the intermediate and deep regions, with highest density towards the posterior zone. sp5l+ uts1+ cells represented a rare population located in the intermediate SPV region. f, scRNA-seq data for clusters expressing sp5l.

Expression Data

Expression Detail
Antibody Labeling
Phenotype Data

Phenotype Detail
Acknowledgments
This image is the copyrighted work of the attributed author or publisher, and ZFIN has permission only to display this image to its users. Additional permissions should be obtained from the applicable author or publisher of the image. Full text @ Nature