FIGURE SUMMARY
Title

The administration of exogenous HSP47 as a collagen specific therapeutic approach

Authors
Besio, R., Garibaldi, N., Sala, A., Tonelli, F., Aresi, C., Maffioli, E., Casali, C., Torriani, C., Biggiogera, M., Villani, S., Rossi, A., Tedeschi, G., Forlino, A.
Source
Full text @ JCI Insight

Recombinant heat shock protein 47 (rHSP47) is taken up by human fibroblasts.

(A) The intracellular uptake and presence of rHSP47-GFP is shown by bright-field and immunofluorescence (n = 3, representative image is shown). (B and C) Representative immunofluorescence images of primary wild-type fibroblasts incubated with rHSP47-GFP and stained for the ER markers protein disulfide isomerase (PDI) and calnexin (n = 3), (D) with the cis-Golgi marker Golgi matrix protein 130 (GM130), and with markers of the secretory vesicles (n = 3) (E) coat protein complex 2 (COP2) (n = 3) and (F) kelch-like family member 12 (KLHL12) (n = 3). Colocalization of rHSP47-GFP with cis-Golgi and secretory vesicles, but not with ER, is indicated by the overlapping peaks in the graphs. Nuclei were counterstained with DAPI. Original magnification, ×63 (insets further magnified ×4.5).

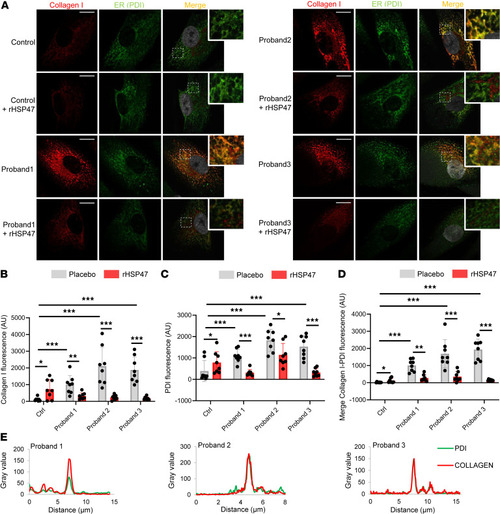
Treatment with rHSP47 reduces intracellular procollagen retention.

(AD) Representative images (A) and quantification of immunofluorescence of (B) collagen I (aligned rank ANOVA [ARA] test, FARA = 18.06, P < 0.001 by overall test), (C) ER marker protein disulfide isomerase (PDI) (ARA test, FARA = 15.12, P < 0.001 by overall test), and of (D) collagen I–PDI signal (ARA test, FARA = 40.35, P < 0.001 by overall test) of osteogenesis imperfecta (OI) proband and control fibroblasts treated for 16 hours with 0.5 μM rHSP47 or with placebo. Asterisks in BD indicate the post hoc test results. Biological replicates (n = 3) were performed. For each biological replicate, the signal was quantified on 8 images (original magnification, ×40) for each genotype/condition (number of cells, >90). Error bars indicate SD. (E) The colocalization of collagen I–PDI signal in proband 1, 2, and 3 cells is evident by the 2 overlapping peaks in the graph (n = 3). Nuclei were counterstained with DAPI. Scale bars: 15 μm. Zoomed inset magnification, ×3. Statistical analyses details are reported in Supplemental Table 2. *P < 0.05; **P ≤ 0.01; ***P ≤ 0.001.

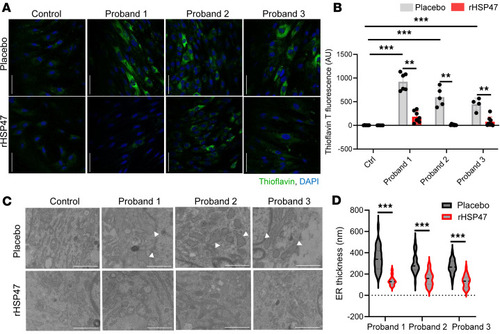
rHSP47 ameliorates cellular homeostasis.

ER proteostasis was evaluated by thioflavin T (ThT) labeling of protein aggregates in osteogenesis imperfecta (OI) proband and control fibroblasts treated for 16 hours with 0.5 μM rHSP47 or with placebo. (A) Representative immunofluorescence images and (B) ThT quantification (aligned rank ANOVA [ARA] test, FARA = 86.82) is shown (P < 0.001 by overall test; asterisks indicate post hoc test results). Biological replicates (n = 3) were performed. For each biological replicate, the signal was quantified on 7 images (original magnification, ×40) for each genotype/condition (number of cells >70). Error bars indicate SD. Scale bars: 20 μm. (C) Representative transmission electron microscopy images of OI probands and control fibroblasts treated for 16 hours with 0.5 μM rHSP47 or with placebo (n = 3). Arrowheads show ER enlargement. Scale bars: 2 μm. (D) ER enlargement was quantified for 30 proband cells treated with rHSP47 or with placebo. Mann-Whitney Wilcoxon test, MW = 6.35 (P < 0.001 by overall test; asterisks indicate post hoc test results). Statistical analyses details are reported in Supplemental Table 2. **P ≤ 0.01; ***P ≤ 0.001.

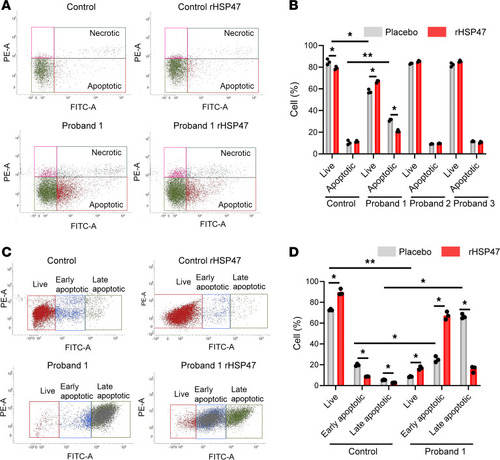
rHSP47 modulates cell apoptosis.

(A) FACS analysis detection of apoptotic cells in OI probands and control fibroblasts treated with rHSP47 or with placebo following annexin V (FITC) and propidium iodide (PI) staining. The fraction of apoptotic events in the cells is shown in representative plots and (B) quantified in the histogram. Biological replicates (n = 3) were performed. Error bars indicate SD. (C) FACS analysis of apoptotic cells in OI proband 1 and control fibroblasts treated with rHSP47 or with placebo following a high-stress condition induced by culturing the cells for 7 days without media change. The fraction of apoptotic events in the cells is shown in representative plots and (D) quantified in the histogram. Both early and late apoptotic cells were quantified. Biological replicates (n = 3) were performed. Error bars indicate SD. Mann-Whitney Wilcoxon test was performed. Statistical analyses details are reported in Supplemental Table 2. *P < 0.05; **P ≤ 0.01.

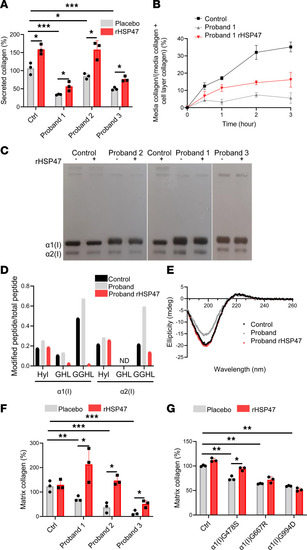
rHSP47 increases collagen secretion, reduces collagen overmodifications, and enhances collagen I deposition in the ECM.

(A) rHSP47 effect on collagen secretion was evaluated in osteogenesis imperfecta (OI) probands and control fibroblasts. Secreted collagen was quantified in the last 24-hour culture media of fibroblasts after 7 days of culture with or without a 4-hour rHSP47 pulse (0.5 μM) every other day. Biological replicates (n = 3) were performed. For each biological replicate, collagen was quantified in 3 different wells for each condition. Kruskal-Wallis (KW) test, KW = 17.93 (P = 0.0005 by overall test; asterisks indicate post hoc test results). (B) Collagen secretion kinetics was evaluated in proband 1 by incubating the cells for 4 hours with 3H-proline. Technical replicates (n = 3) were performed. (C) Representative SDS-urea-PAGE of 3H-labeled collagen extracted from the medium of control and OI probands’ fibroblasts treated for 16 hours with 0.5 μM rHSP47 or with placebo. Biological replicates (n = 3) were performed. (D) Tandem mass spectrometry data of collagen I extracted from culture media of control and proband fibroblasts to evaluate lysyl hydroxylation and lysine O-glycosylation along the collagen helix (n = 3, pooled). Hydroxylysine (Hyl), galactosyl-hydroxylysine (GHL), and glucosylgalactosyl-hydroxylysine (GGHL) sites were identified by the analysis. The ratio between the posttranslationally modified peptides and the total peptides is reported. Light gray bars show proband 3 and red bars show proband 3 rHSP47. (E) Circular dichroism spectra reveal the collagen triple helical signal as a positive peak at 222 nm and negative peak below 200 nm in all samples (n = 3). Proband 3 is shown in light gray and proband 3 rHSP47 is shown in red. (F) The amount of collagen incorporated into the ECM was evaluated by Picrosirius red staining in cells grown for 7 days in the absence or presence of a 0.5 μM rHSP47 4-hour pulse performed every other day. Biological replicates (n = 3) were performed. For each biological replicate, collagen was quantified in 3 different wells for each condition. (G) The amount of collagen incorporated into the ECM was evaluated in fibroblasts from probands with collagen I mutations as reported in F (n = 3). Error bars indicate SD. Mann-Whitney Wilcoxon test was applied. Kruskal-Wallis (KW) test was also applied to describe the secreted collagen by genotype. Statistical analyses are described in Supplemental Table 2. *P < 0.05; **P ≤ 0.01; ***P ≤ 0.001.

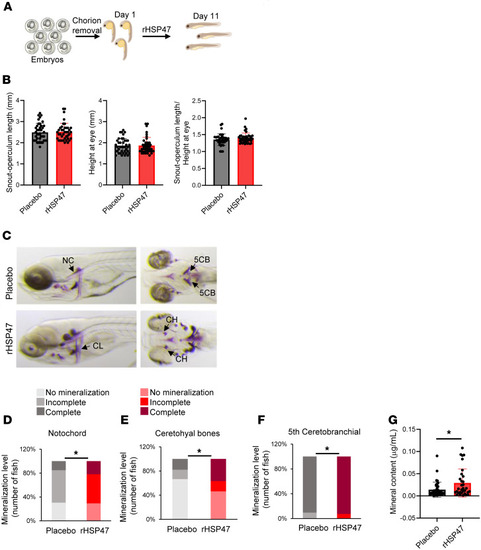
Treatment with rHSP47 ameliorates zebrafish p3h1–/– larvae bone mineralization.

(A) Upon mechanical chorion removal, embryos from prolyl 3-hydroxylase 1–knockout (p3h1–/–) zebrafish were treated every other day with a 4-hour pulse of 0.5 μM rHSP47 or with placebo. At 11 dpf, the skeletons of larvae were stained with alizarin red in order to assess the rHSP47 effect on mineralization. (B) Analysis of the fish morphology was carried out measuring the snout-operculum length, the height at eye, and the snout-operculum length/height-at-eye ratio (n ≥ 40). (C) Lateral and ventral images of p3h–/– larvae, treated with rHSP47 or placebo, upon mineral staining by alizarin red. (DF) Bone mineralization level analyzed in rHSP47-treated and untreated fish. Three classes of mineralization were defined, namely, no mineralization, incomplete, and complete, based on the level of alizarin red staining. Biological replicates (n ≥ 41) were performed. (G) Total larvae mineral content was extracted and quantified by spectrophotometric analyses. Biological replicates (n = 32) were performed. Error bars indicate SD. Mann-Whitney Wilcoxon test was applied. Statistical analyses details are reported in Supplemental Table 2. *P ≤ 0.05.

Acknowledgments
This image is the copyrighted work of the attributed author or publisher, and ZFIN has permission only to display this image to its users. Additional permissions should be obtained from the applicable author or publisher of the image. Full text @ JCI Insight