|
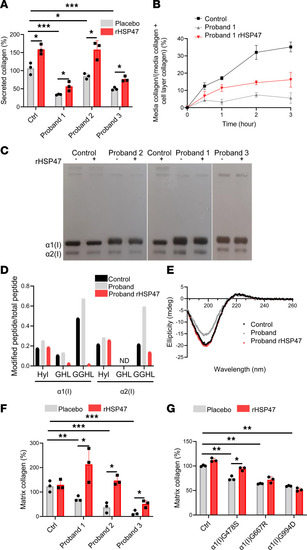
rHSP47 increases collagen secretion, reduces collagen overmodifications, and enhances collagen I deposition in the ECM. (A) rHSP47 effect on collagen secretion was evaluated in osteogenesis imperfecta (OI) probands and control fibroblasts. Secreted collagen was quantified in the last 24-hour culture media of fibroblasts after 7 days of culture with or without a 4-hour rHSP47 pulse (0.5 μM) every other day. Biological replicates (n = 3) were performed. For each biological replicate, collagen was quantified in 3 different wells for each condition. Kruskal-Wallis (KW) test, KW = 17.93 (P = 0.0005 by overall test; asterisks indicate post hoc test results). (B) Collagen secretion kinetics was evaluated in proband 1 by incubating the cells for 4 hours with 3H-proline. Technical replicates (n = 3) were performed. (C) Representative SDS-urea-PAGE of 3H-labeled collagen extracted from the medium of control and OI probands’ fibroblasts treated for 16 hours with 0.5 μM rHSP47 or with placebo. Biological replicates (n = 3) were performed. (D) Tandem mass spectrometry data of collagen I extracted from culture media of control and proband fibroblasts to evaluate lysyl hydroxylation and lysine O-glycosylation along the collagen helix (n = 3, pooled). Hydroxylysine (Hyl), galactosyl-hydroxylysine (GHL), and glucosylgalactosyl-hydroxylysine (GGHL) sites were identified by the analysis. The ratio between the posttranslationally modified peptides and the total peptides is reported. Light gray bars show proband 3 and red bars show proband 3 rHSP47. (E) Circular dichroism spectra reveal the collagen triple helical signal as a positive peak at 222 nm and negative peak below 200 nm in all samples (n = 3). Proband 3 is shown in light gray and proband 3 rHSP47 is shown in red. (F) The amount of collagen incorporated into the ECM was evaluated by Picrosirius red staining in cells grown for 7 days in the absence or presence of a 0.5 μM rHSP47 4-hour pulse performed every other day. Biological replicates (n = 3) were performed. For each biological replicate, collagen was quantified in 3 different wells for each condition. (G) The amount of collagen incorporated into the ECM was evaluated in fibroblasts from probands with collagen I mutations as reported in F (n = 3). Error bars indicate SD. Mann-Whitney Wilcoxon test was applied. Kruskal-Wallis (KW) test was also applied to describe the secreted collagen by genotype. Statistical analyses are described in Supplemental Table 2. *P < 0.05; **P ≤ 0.01; ***P ≤ 0.001.
|