
- Title
-
Combined loss of glyoxalase 1 and aldehyde dehydrogenase 3a1 amplifies dicarbonyl stress, impairs proteasome activity resulting in hyperglycemia and activated retinal angiogenesis
- Authors
- Li, S., Li, H., Bennewitz, K., Poschet, G., Buettner, M., Hausser, I., Szendroedi, J., Nawroth, P.P., Kroll, J.
- Source
- Full text @ Metab. Clin. Exp.
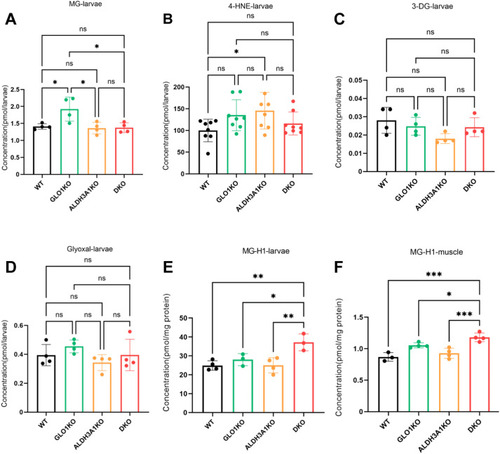
DKO zebrafish displayed an elevation of endogenous MG-H1. (A) MG levels were unchanged in DKO larvae compared to WT, GLO1KO and ALDH3A1KO larvae. n = 4. (B) 4-HNE concentration was unchanged in DKO larvae compared to WT larvae. n = 7–8. (C–D) The levels of other dicarbonyl compounds were unchanged in DKO larvae compared to WT, GLO1KO and ALDH3A1KO larvae. n = 4. (E) Protein-bound MG-H1 levels were the highest in DKO larvae compared to WT, GLO1KO and ALDH3A1KO larvae. n = 3–4. (F) Protein-bound MG-H1 levels were the highest in DKO muscle compared to WT, GLO1KO and ALDH3A1KO muscle. n = 3–4. The bars indicate mean ± SD values. Statistical analysis was applied by one-way ANOVA or Kruskal-Wallis test, ns = not significant, *p < 0.05, **p < 0.01, ***p < 0.001. MG, methylglyoxal; 4-HNE, 4-hydroxynonenal; 3-DG, 3-deoxyglucosone; MG-H1, methylglyoxal-derived hydroimidazolone 1. |
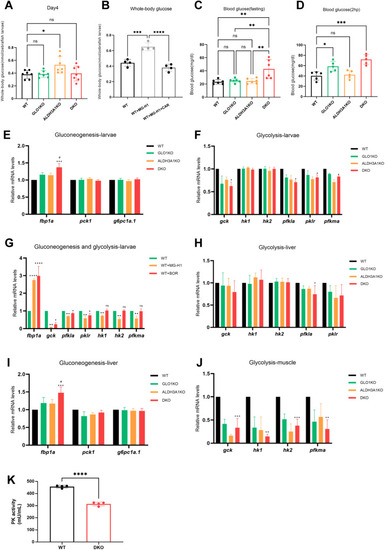
Impaired glucose homeostasis in DKO zebrafish and MG-H1 treated larvae. (A) The whole-body glucose was unchanged in DKO larvae compared to WT larvae. n = 7 clutches with 20 larvae. (B) Whole-body glucose was increased in larvae treated with 1 mM MG-H1 compared to the untreated larvae, and it was reduced in larvae co-treated with 1 mM MG-H1 and 10 mM CAR. n = 4 clutches with 20 larvae. (C) Fasting blood glucose in DKO adult zebrafish was elevated compared to WT, GLO1KO and ALDH3A1KO zebrafish, n = 6. (D) 2-hour postprandial blood glucose was increased in DKO zebrafish compared to WT. n = 5. (E–G) The upregulated gluconeogenesis and downregulated glycolysis in DKO larvae and larvae treated with MG-H1 and BOR, n = 4. (H–J) The relative expression levels of key genes responsible for gluconeogenesis and glycolysis in liver and muscle tissues, n = 4. mRNA expression levels were quantified by RT-qPCR and normalized to arnt2. (K) Pyruvate kinase activity in DKO larvae was significantly decreased compared to WT. n = 4. The bars indicate mean ± SD values. Statistical analysis was applied by Student's t-test or one-way ANOVA, ns = not significant, *p < 0.05, **p < 0.01, ***p < 0.001, ****p < 0.0001, significantly different from the WT group; #p < 0.05, significantly different from the single knockout group. MG-H1, methylglyoxal-derived hydroimidazolone 1; BOR, bortezomib; CAR, L-Carnosine; arnt2, aryl hydrocarbon receptor nuclear translocator 2; fbp1a, fructose-1,6-bisphosphatase 1a; pck1, phosphoenolpyruvate carboxykinase 1; g6pc1a.1, glucose-6-phosphatase catalytic subunit 1a; gck, glucokinase; hk1, hexokinase 1; hk2, hexokinase 2; pfkla, phosphofructokinase, liver a; pklr, pyruvate kinase L/R; pfkma, phosphofructokinase, muscle a. |
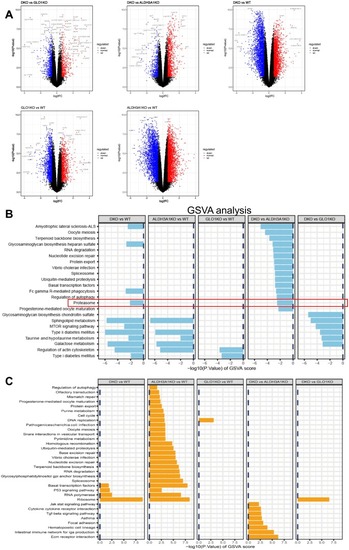
Differential gene expression analysis and GSVA. (A) DGE analysis between each two group (DKO vs GLO1KO, DKO vs ALDH3A1KO, DKO vs WT, GLO1KO vs WT, ALDH3A1KO vs WT). (B) GSVA of RNA-sequences showed the significantly downregulated pathways between each two group (DKO vs WT, ALDH3A1KO vs WT, GLO1KO vs WT, DKO vs ALDH3A1KO, DKO vs GLO1KO) at 96hpf. n = 5 clutches with 20 larvae in each group. (C) GSVA of RNA-sequences showed the significantly upregulated pathways between each two group (DKO vs WT, ALDH3A1KO vs WT, GLO1KO vs WT, DKO vs ALDH3A1KO, DKO vs GLO1KO) at 96hpf. n = 5 clutches with 20 larvae in each group. DGE, differential gene expression; GSVA, gene set variation analysis; hpf, hours of post fertilization. |

Downregulated proteasome pathway and activity in DKO zebrafish, which lead to MG-H1 accumulation and form a feedback loop in larvae. (A) Heat map showed relative mRNA expression levels of genes from the proteasome pathway gene set. Higher and lower expressions are displayed in orange and blue, respectively. n = 5 clutches with 20 larvae in each group. (B–C) Proteasome activity (chymotrypsin-like) was decreased in DKO larvae and muscle compared to WT, GLO1KO and ALDH3A1KO zebrafish, n = 6. (D) Proteasome activity (chymotrypsin-like) was significantly reduced in larvae treated with 1 mM MG-H1 compared to the untreated larvae, and it was significantly increased in larvae co-treated with 1 mM MG-H1 and 10 mM CAR. n = 4. (E) Protein-bound MG-H1 levels were increased in larvae treated with 7.5 μM BOR compared to the untreated larvae. n = 4. (F) Graphical overview of the feedback loop between MG-H1 and proteasome activity. Figure was created with BioRender.com. (G) Crystal structure of the β5 subunit of proteasome in zebrafish (gray) in complex with MG-H1 (green). Identified sites are highlighted in red. Hydrogen bonds (black dashed lines), salt bridges (yellow dashed lines) and hydrophobic (gray dashed lines) between MG-H1 and the amino acids are shown. The bars indicate mean ± SD values. Statistical analysis was applied by Student's t-test and one-way ANOVA, *p < 0.05, **p < 0.01, ***p < 0.001, ****p < 0.0001. MG-H1, methylglyoxal-derived hydroimidazolone 1; CAR, L-Carnosine; BOR, bortezomib. |

Aggravated retinal vasculature alterations in DKO larvae and DKO adult zebrafish. (A) Representative confocal images of the hyaloid vasculature showed amplified alterations in DKO zebrafish larvae at 120hpf compared to WT, GLO1KO and ALDH3A1KO larvae. Red arrows indicated branch points, and yellow arrows indicated sprouts. White scale bar = 20 μm. (B) Quantification of increased branch points formation in the hyaloid vasculature in DKO larvae compared to WT, GLO1KO and ALDH3A1KO larvae, n = 41–67. (C) Quantification of increased vessel diameter in the hyaloid vasculature in DKO larvae compared to WT larvae, n = 41–67. (D) Quantification of sprouts formation in the hyaloid vasculature in DKO larvae, n = 41–67. (E) Representative confocal images of retinal vasculature showed increased sprouts in DKO adult zebrafish at 12 mpf. Red arrows indicated branch points, and yellow arrows indicated sprouts. White scale bar = 350 μm. (F) Quantification of increased sprouts formation in the retinal vasculature in DKO adult zebrafish, n = 18–23. (G) Quantification of branch points formation in the retinal vasculature in DKO adult zebrafish, n = 18–23. The bars indicate mean ± SD values. Statistical analysis was performed by one-way ANOVA or Kruskal-Wallis test. ns, not significant, *p < 0.05, **p < 0.01, ***p < 0.001, ****p < 0.0001. hpf, hours of post fertilization; mpf, months of post fertilization. |
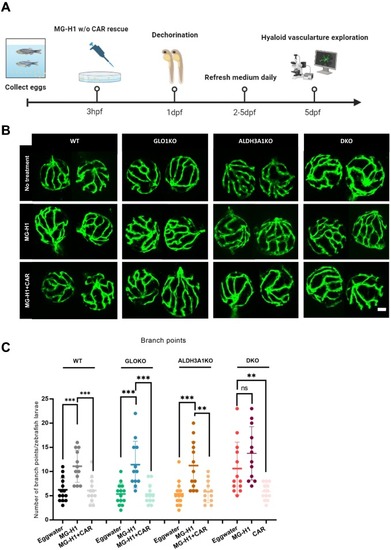
Alteration of hyaloid vasculature in larvae treated with MG-H1, which could be rescued by MG-H1 scavenger. (A) Scheme of experimental design for hyaloid vasculature exploration in larvae treated with MG-H1 with or without CAR rescue. Figure was created with BioRender.com. (B) Representative confocal images of the hyaloid vasculature showed amplified alterations in WT, GLO1KO and ALDH3A1KO larvae treated with 1 mM MG-H1, and attenuated alterations in larvae co-treated with 1 mM MG-H1 and 10 mM CAR. White scale bar = 20 μm. (C) Increased hyaloid branch points in WT, GLO1KO and ALDH3A1KO larvae treated with 1 mM MG-H1 was observed compared to the larvae without treatment, but no alteration was observed in DKO larvae treated with MG-H1, and these vasculature alterations can be rescued by CAR. n = 12–14. The bars indicate mean ± SD values. Statistical analysis was applied by one-way ANOVA, ns = not significant, **p < 0.01, ***p < 0.001. hpf, hours of post fertilization; dpf, days of post fertilization; w/o, with or without; MG-H1, methylglyoxal-derived hydroimidazolone 1; CAR, L-Carnosine. |
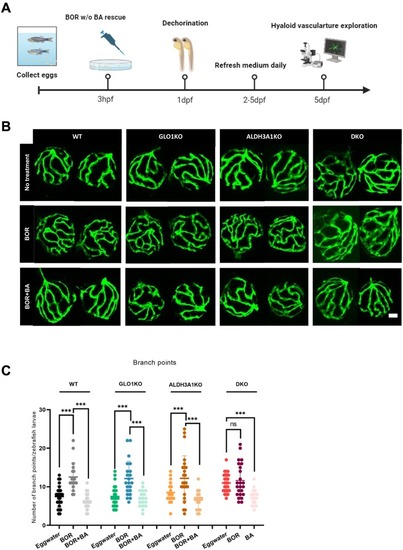
Alteration of hyaloid vasculature in larvae treated with proteasome inhibitor, which could be rescued by proteasome activator. (A) Scheme of experimental design for hyaloid vasculature exploration in larvae treated with BOR with or without BA rescue. Figure was created with BioRender.com. (B) Representative confocal images of the hyaloid vasculature showed amplified alterations in WT, GLO1KO and ALDH3A1KO larvae treated with 7.5 μM BOR, and attenuated alterations in larvae co-treated with 7.5 μM BOR and 200 μM BA. White scale bar = 20 μm. (C) Increased hyaloid branch points in WT, GLO1KO and ALDH3A1KO larvae treated with 7.5 μM BOR was observed compared to the larvae without treatment, but no alteration was observed in DKO larvae treated with BOR, and these vasculature alterations can be rescued by 200 μM BA. n = 17–26. The bars indicate mean ± SD values. Statistical analysis was applied by one-way ANOVA, ns = not significant, ***p < 0.001. hpf, hours of post fertilization; dpf, days of post fertilization; w/o, with or without; BOR, bortezomib; BA, betulinic acid. |
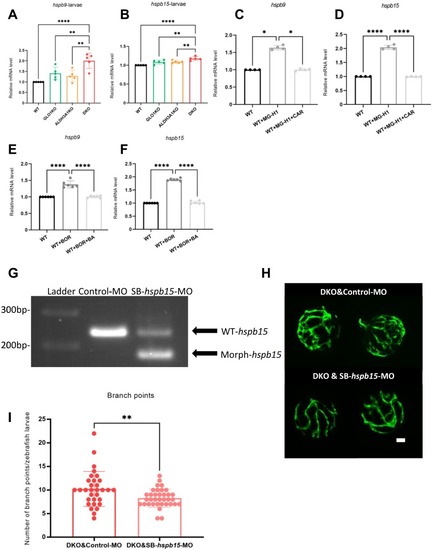
Upregulation of hspb9 and hspb15 mRNA expression in DKO larvae and their modulation by MG-H1 and BOR treatments. (A–B) Hspb9 and hspb15 mRNA expression levels were upregulated in DKO larvae compared to WT, GLO1KO and ALDH3A1KO larvae. n = 5. (C–D) The mRNA expression levels of hspb9 and hspb15 were significantly increased in larvae treated with 1 mM MG-H1 compared to the larvae without treatment, and significantly decreased in larvae co-incubated with MG-H1 and CAR. n = 4. (E–F) The mRNA expression levels of hspb9 and hspb15 were significantly increased in larvae treated with 7.5 μM BOR compared to the larvae without treatment, and significantly decreased in larvae co-incubated with BOR and BA. n = 6. mRNA expression level was measured by RT-qPCR and normalized to arnt2. (G) Validation of splice-modifying morpholino of hspb15 targeting exon2-intron2: SB-hspb15-MO. RT-PCR of Control-MO, and SB-hspb15-MO injected larvae showed wild type and generation of morphant hspb15 signals at 120hpf. 2 ng of morpholinos: Control-MO and SB-hspb15-MO were injected into the one-cell stage of zebrafish embryos, respectively. (H) Representative confocal images of the hyaloid vasculature showed alleviated alteration in DKO larvae injected with hspb15 morpholino at 120hpf compared to the control-MO. White scale bar = 20 μm. (I) Quantification of deceased branch points formation in the hyaloid vasculature in DKO larvae injected with hspb15 morpholino. n = 31–35. The bars indicate mean ± SD values. Statistical analysis was applied by Student's t-test and one-way ANOVA, ns = not significant, *p < 0.05, **p < 0.01, ****p < 0.0001. MG-H1, methylglyoxal-derived hydroimidazolone 1; CAR, L-Carnosine; BOR, bortezomib; BA, betulinic acid; arnt2, aryl hydrocarbon receptor nuclear translocator 2; hspb9, heat shock protein, alpha-crystallin-related, 9; hspb15, heat shock protein, alpha-crystallin-related, b15; WT, wild type; MO, morpholino; Morph, morphant; RT-PCR, reverse transcription-polymerase chain reaction. |